
What Drives Switzerland's Population Growth?
How natural increase and net migration contributed to changes in Switzerland's permanent resident population from 1971 to 2025.
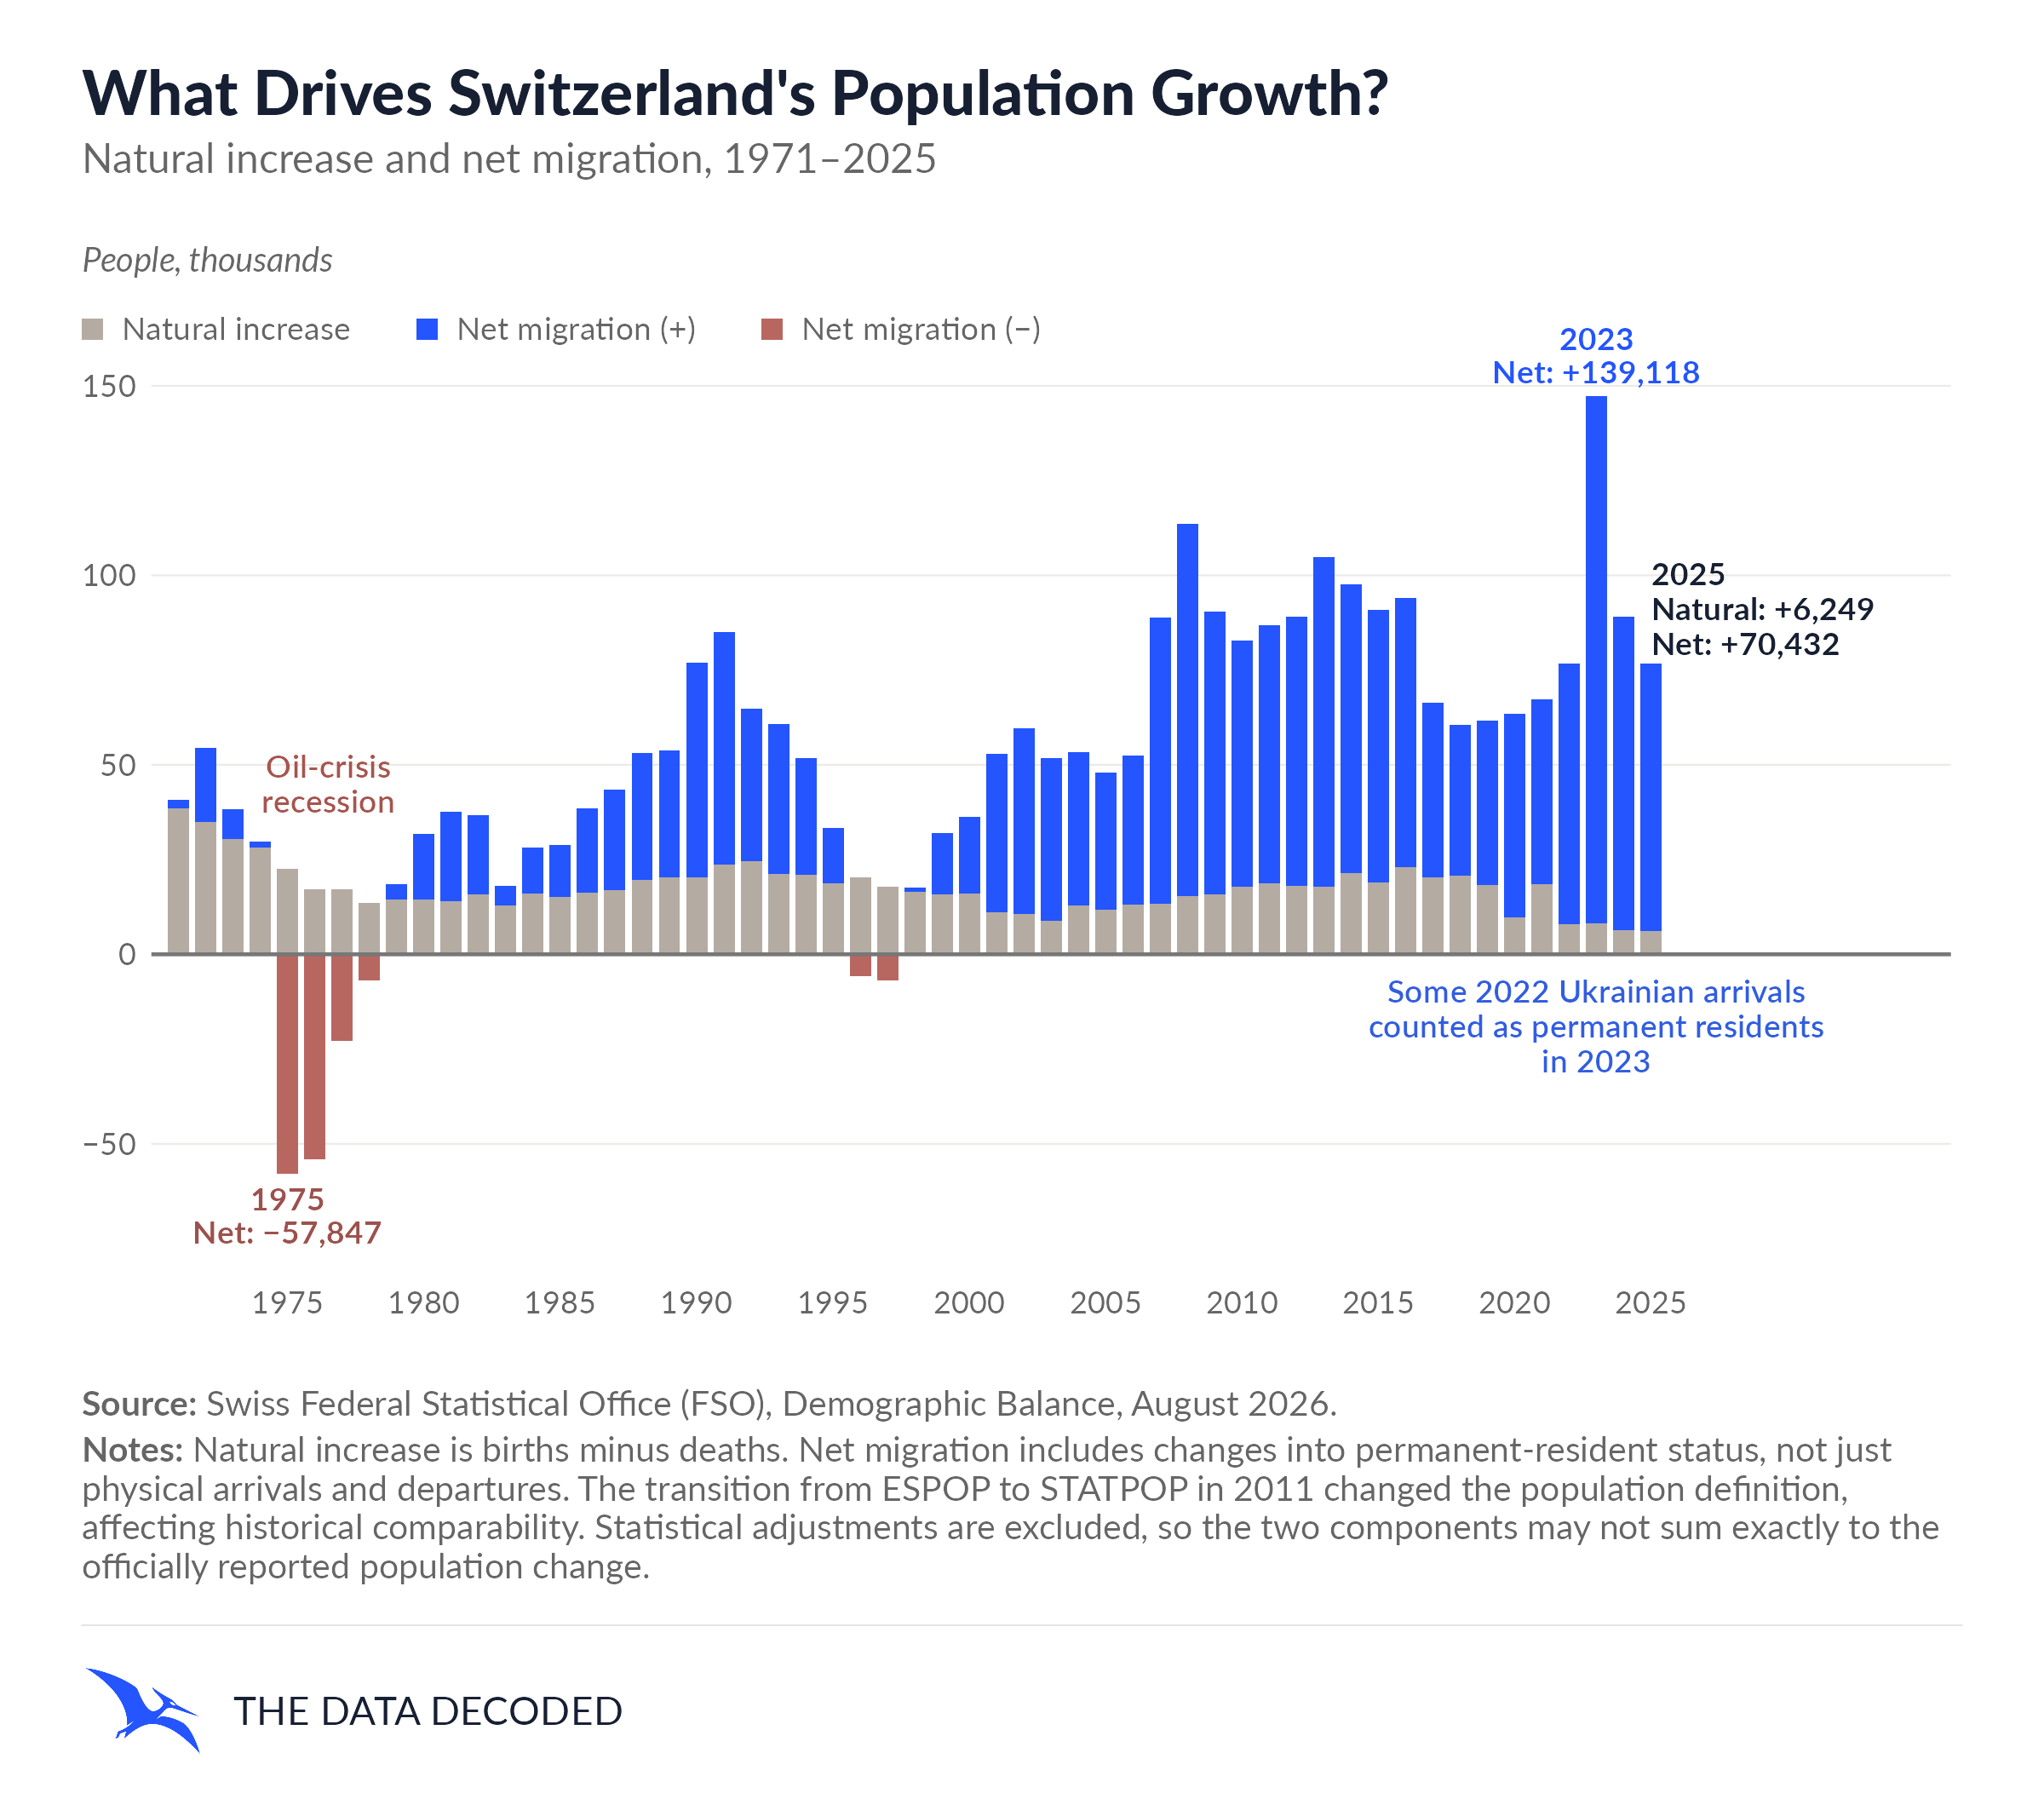
Natural increase—the excess of births over deaths—fell from 38,405 in 1971 to 6,249 in 2025, the lowest value in this series. It remained positive in every year, though it did not decline steadily. Net migration rose from 2,275 in 1971 to 70,432 in 2025. In 2025, migration made up 91.9% of the combined natural increase and net migration, before statistical adjustments.
Net migration was negative in 1975–1978 and 1996–1997. In 1975, natural increase of 22,540 was outweighed by net migration of −57,847; the official population change was −35,307. Positive and negative components extend in opposite directions from zero, so the top of the positive column is not the total when migration is negative.
For 2016–2025, the two components summed to 803,333 people: 663,967 from net migration and 139,366 from natural increase. Migration accounted for 82.7% of this combined amount, excluding adjustments. In 2023, net migration reached 139,118, the highest value in the period, while natural increase was 8,202. See the companion net migration chart for a closer look at the migration series.
Sources and methodology
The Swiss Federal Statistical Office (FSO) demographic balance by canton supplies the figures for Switzerland, total citizenship and both sexes. The source table was updated in August 2026. The archived API response, query, metadata and processed data are included with the project. Natural increase is births minus deaths; the plotted migration balance includes changes into permanent-resident status.
The chart covers the permanent resident population, not all people physically entering or leaving Switzerland. ESPOP covers 1971–2010 and STATPOP begins in 2011; the methods and population definitions differ. Since 2011 the permanent population also includes people in the asylum process after at least 12 months in Switzerland. The FSO notes that the 2010 death figure differs from the official vital statistics figure due to the transition. Comparisons across the break require care.
The FSO counts a change from non-permanent to permanent status in the year of the change, which may differ from the arrival year. The 2023 peak partly reflects people with protection status S who fled Ukraine in 2022 and entered the permanent population after a year in Switzerland; the FSO also identifies strong economic migration. The chart does not assign shares of the peak to particular causes. See the FSO population-scenario discussion. The FSO links net emigration in the mid-1970s to recession; see its population overview.
The chart omits statistical adjustments, so the sum of the two components does not always equal official population change. For 2025, 6,249 + 70,432 − 585 = 76,096. This identity holds for every annual observation in the archived selection. Population counts on 31 December and the following 1 January may differ at census adjustments and the statistical transition; annual changes should not be inferred by subtracting adjacent year-end counts.