
Switzerland's Net Migration, 1971–2025
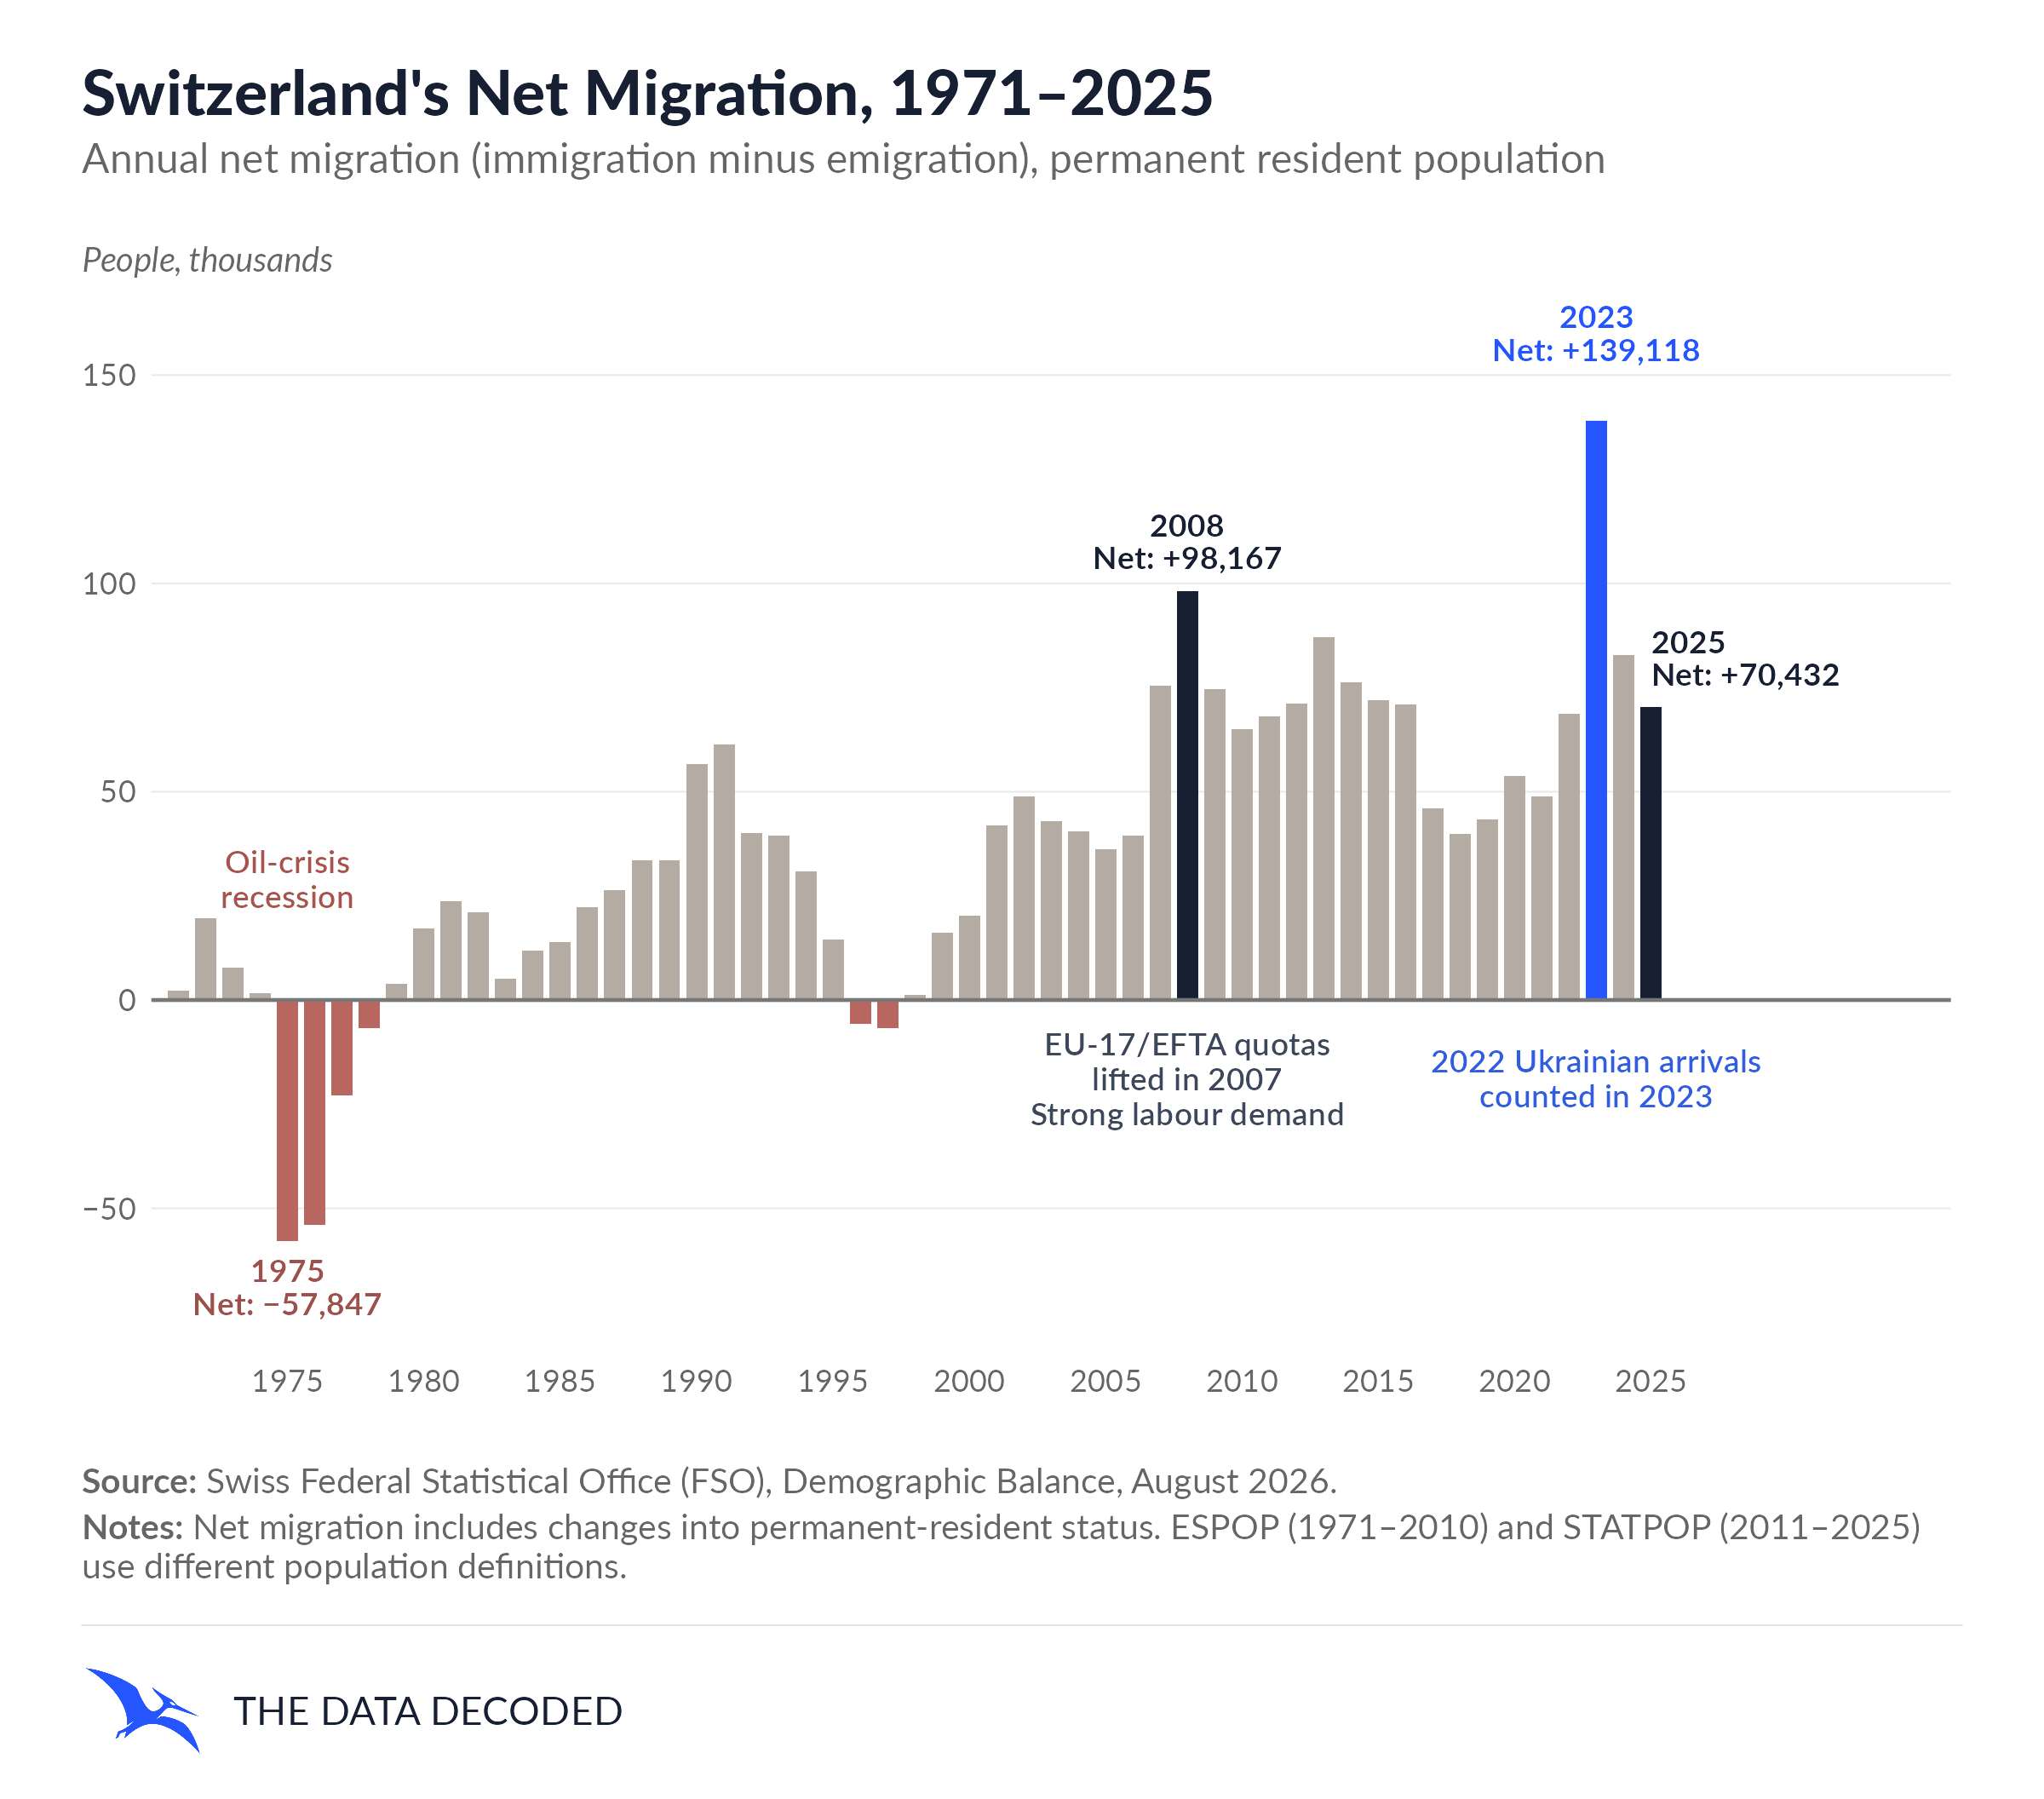
A 55-year view of Switzerland's annual net migration, from net emigration in the 1970s to the 2023 peak and subsequent decline.
Switzerland's annual migration balance has varied substantially over the past 55 years. The balance was negative in 1975–1978 and again in 1996–1997. It reached −57,847 in 1975, the lowest value in the period.
Net migration rose to 98,167 in 2008. The highest value in this series came in 2023, at 139,118; it declined to 82,792 in 2024 and 70,432 in 2025. The 2025 balance remained positive and above most years in the series. These are descriptive comparisons, not explanations of why people moved.
Sources and methodology
The Swiss Federal Statistical Office (FSO), demographic balance by canton supplies all 55 observations. The selection is Switzerland, total citizenship, both sexes, and “net migration including change of population type,” in persons. The table reports data through 2025, updated August 2026; the separate provisional 2025 table was published in April. The opendata.swiss catalogue lists the same FSO demographic balance, so no second historical series is needed. The original API response and selection are preserved in the project data folder.
The FSO uses ESPOP for 1971–2010 and STATPOP from 2011. ESPOP used a demographic balancing equation and several underlying statistics; STATPOP uses population registers. From 2011 the permanent resident population also includes people in the asylum process after at least 12 months in Switzerland. Consequently comparisons across the transition should be interpreted with care. The FSO states that annual immigration and emigration flows are not separately available for 1971–1980, although the net balance is available.
The published net balance includes changes from non-permanent to permanent resident status, counted in the year of the change, which may differ from the year of arrival. According to the FSO, people with protection status S who fled the war in Ukraine in 2022 entered the permanent population after a year in Switzerland and are included in the 2023 balance. The FSO also notes strong economic migration that year; the chart does not attribute a numerical share of the peak to any single cause. See the FSO demographic balance notes and FSO population-scenario discussion.
Historical context
The FSO links the temporary net emigration of the mid-1970s to recession; it describes that recession in the context of the oil crises. Its 2009 population release attributes the particularly high 2008 balance largely to favorable economic conditions and complete free movement with EU-17 and EFTA countries. These are contextual explanations, not estimates of each factor’s contribution. See the FSO population overview, FSO discussion of the oil crises, and FSO 2009 release.
The 2007 quota removal referred to EU-17 and EFTA nationals, not all EU member states: quotas for EU-8 nationals ended in 2011, with other transitional restrictions lasting longer. The State Secretariat for Migration’s 2011 report connects both the quota change and demand for labour to migration flows.