
How US southwest border encounters changed, 2017–2026
Published southwest Border Patrol totals through August 2026, with a monthly timeline and three presidential-term trajectories relative to their starting January daily rates.
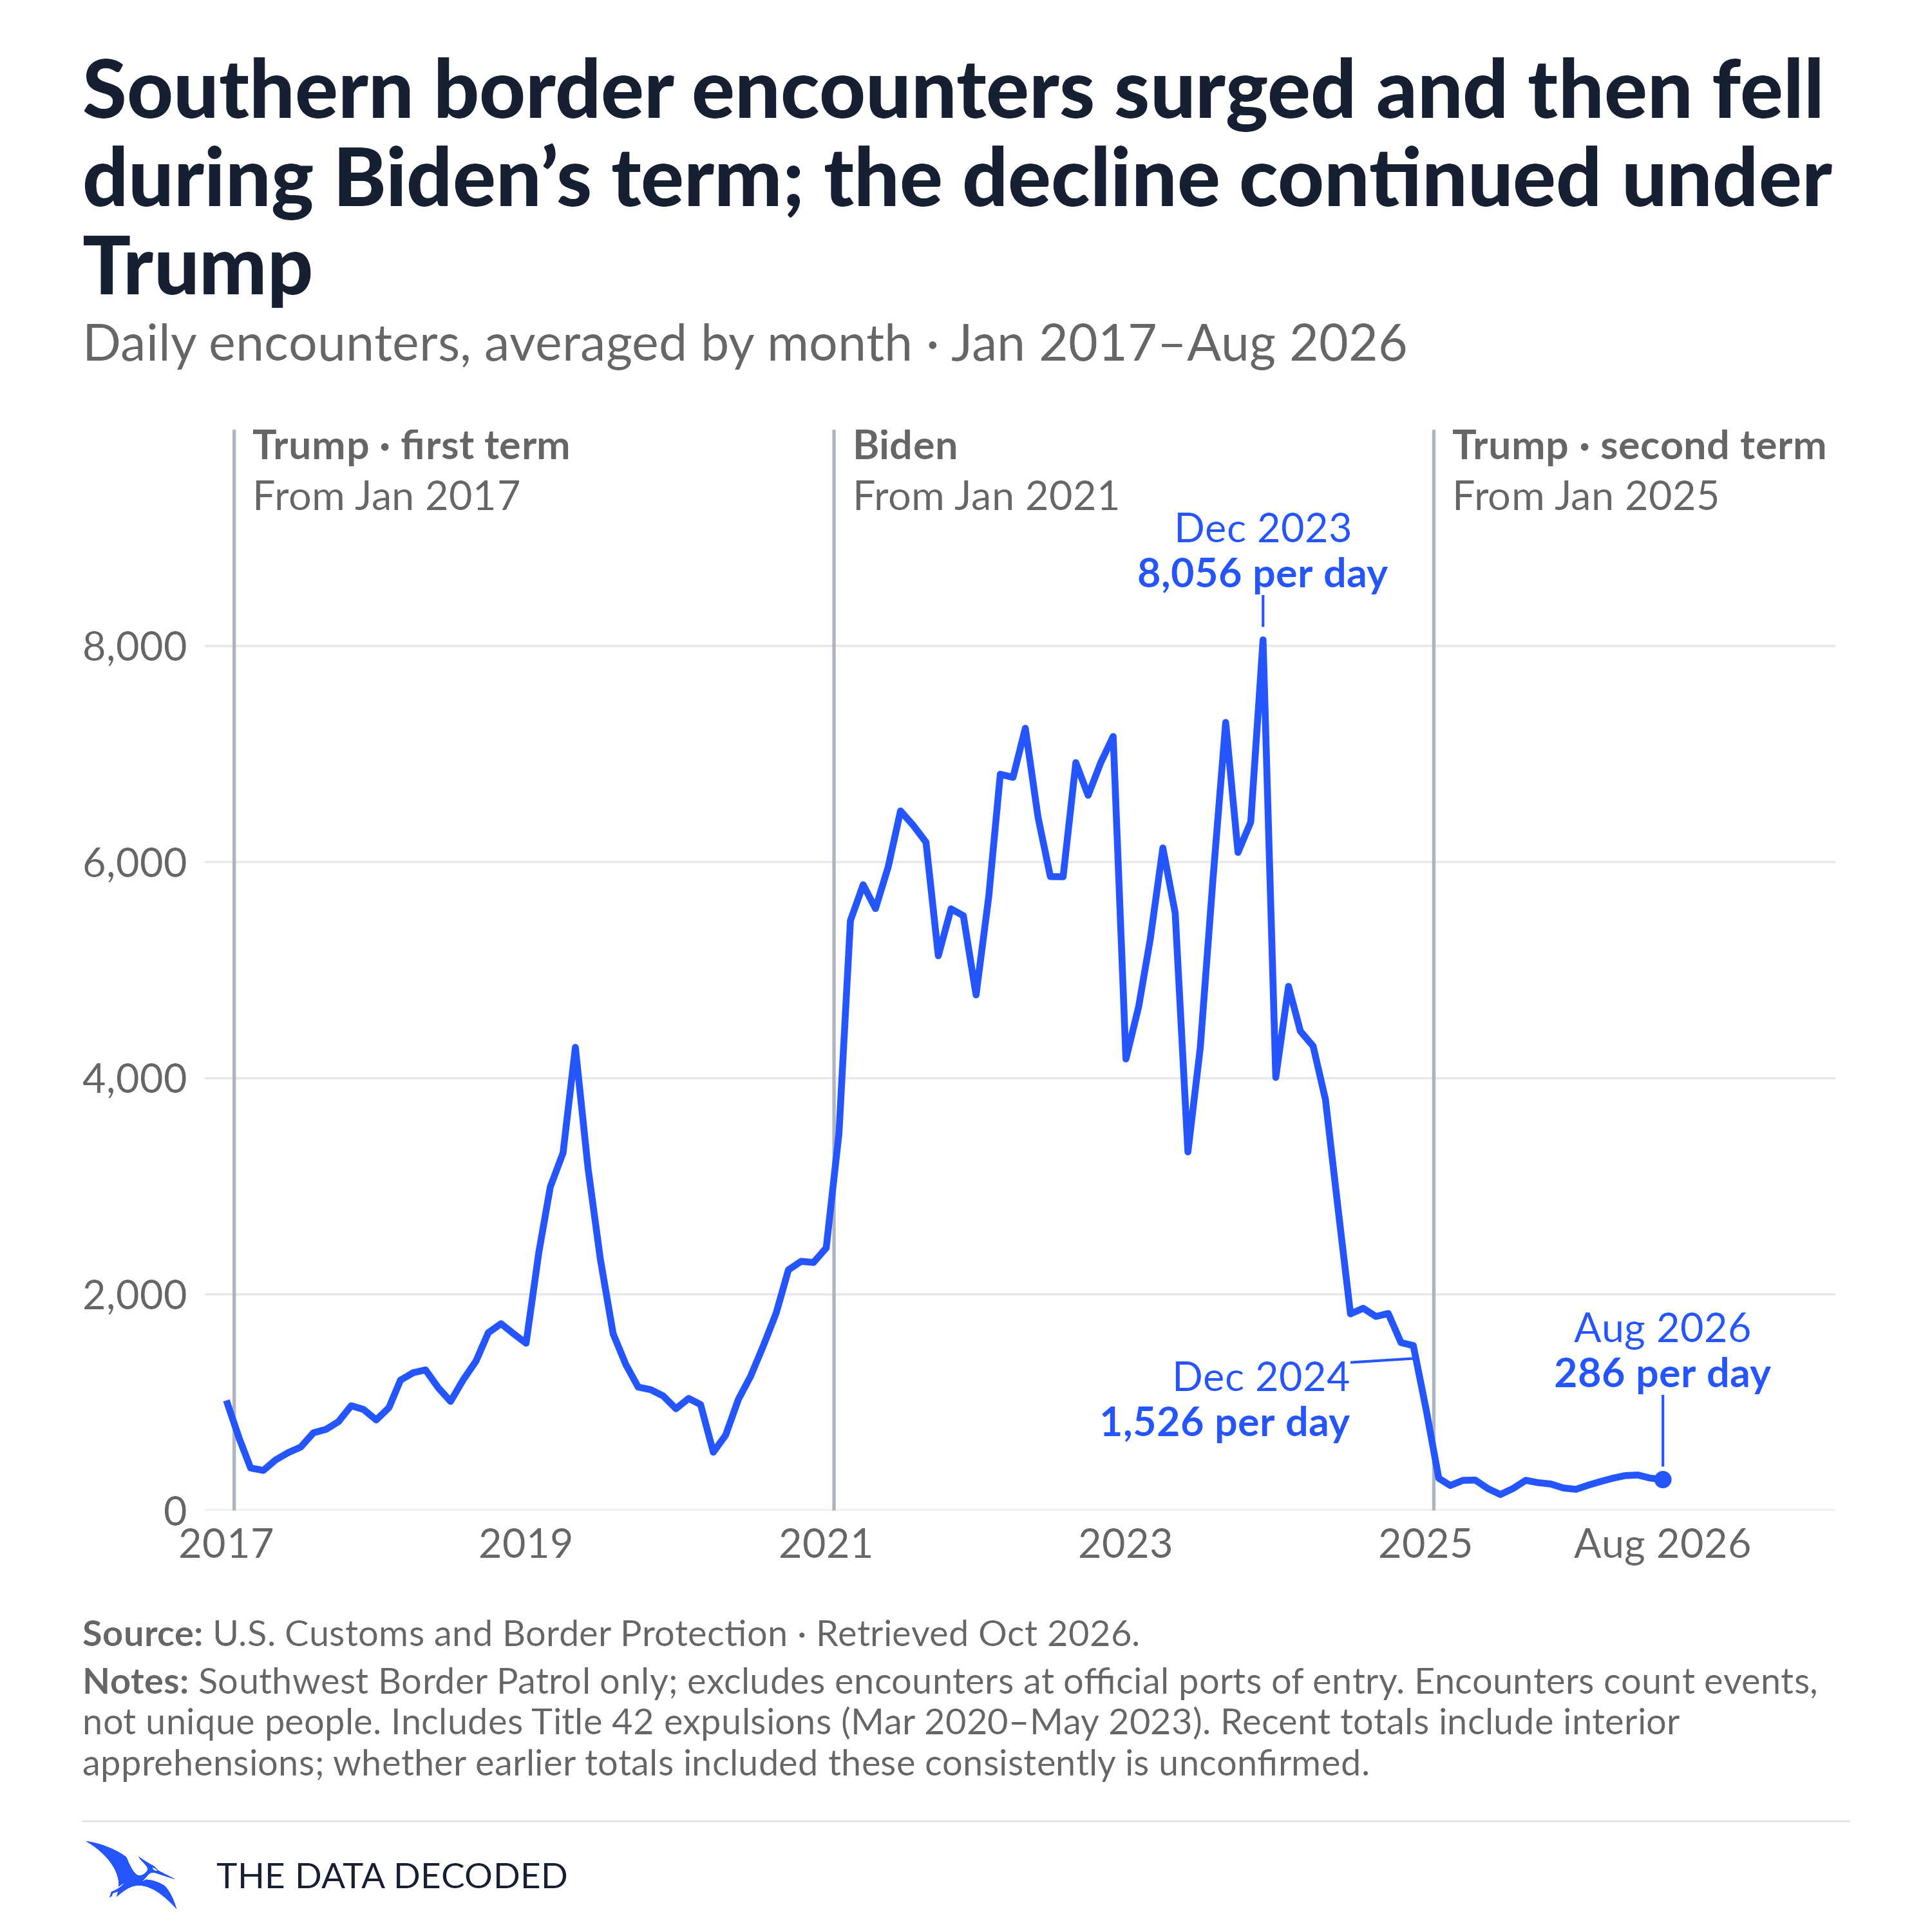
Published southwest U.S. Border Patrol encounters surged in 2021–2023, then fell sharply during Biden’s final year. Much of the decline preceded Trump’s return: encounters fell further in early 2025 and have remained much lower since, with fluctuations. These are recorded enforcement events, not unique migrants or measured border crossings. Presidential dates locate the changes in time; the charts do not isolate the effects of presidential policies.
Findings
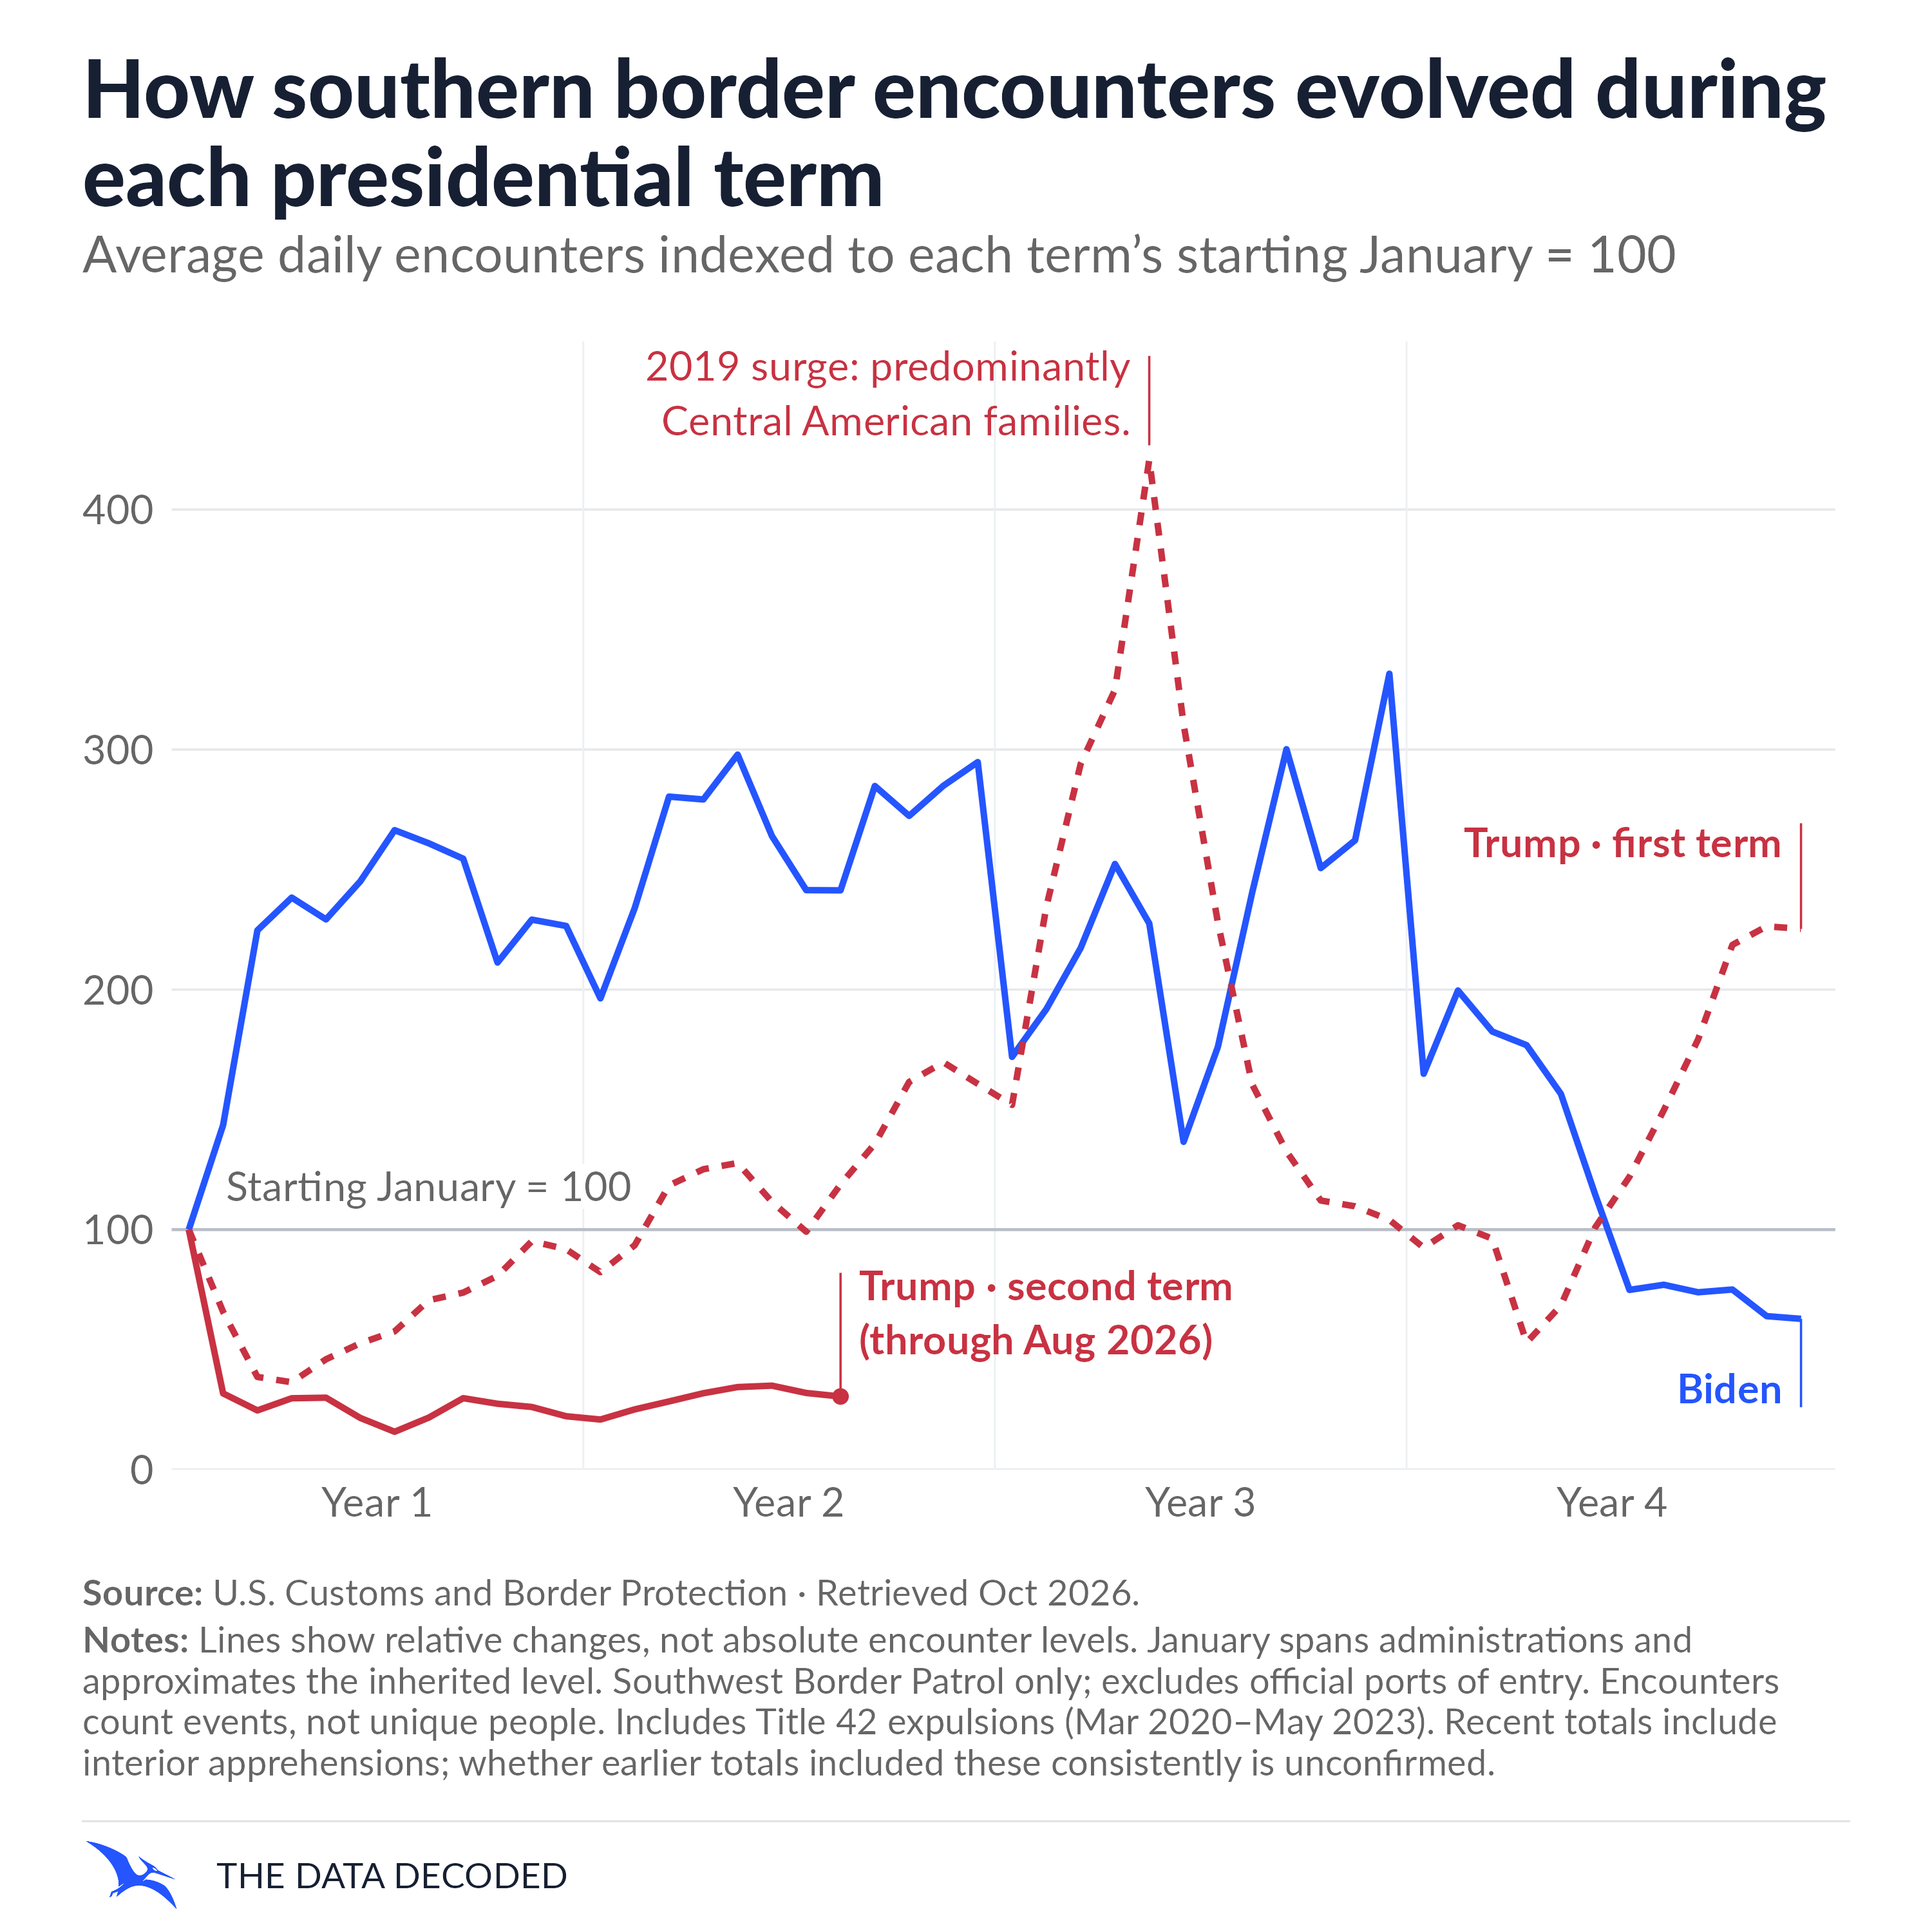
The monthly timeline, “Southern border encounters surged and then fell during Biden’s term; the decline continued under Trump”, establishes the absolute daily rates and timing. The second chart, “How southern border encounters evolved during each presidential term”, compares relative trajectories from three different starting January levels.
| Observation | Published total encounters | Average per day |
|---|---|---|
| December 2023 | 249,740 | 8,056.13 |
| August 2024 | 58,009 | 1,871.26 |
| December 2024 | 47,320 | 1,526.45 |
| January 2025 | 29,105 | 938.87 |
| February 2025 | 8,349 | 298.18 |
| August 2025 | 6,317 | 203.77 |
| August 2026 | 8,870 | 286.13 |
The published daily rate fell 81.1% from December 2023 to December 2024. The decline therefore began before January 2025 and continued into early 2025. Encounters have remained much lower since, with fluctuations rather than an uninterrupted decline through August 2026. December 2023 is the highest published daily rate in the verified project window; historical scope uncertainty limits interpreting that as a consistent border-crossing peak.
August 2026 averaged 286 encounters per day, 84.7% below August 2024, 40.4% above August 2025, and 96.4% below December 2023. These comparisons use published totals, including at-large apprehensions in every compared month.
For August 2026, 8,870 = 7,624 at entry + 1,246 at large. At large accounts for 14.0% of the total, or 40.19 events per day. The separate at-entry sensitivity check gives 245.94/day, 86.5% below August 2024 and 44.3% above August 2025. It is retained for inspection and does not replace either main chart's totals.
Sources and methodology
Coverage and monthly timeline
The official CBP download listing, checked again on October 4, 2026, identifies August 2026 as the latest release. The project covers 116 consecutive months, January 2017–August 2026. September–December 2026 are unavailable and remain missing.
Historical inputs are official FY2017–FY2019 southwest USBP monthly tables and AOR releases covering FY2020–FY2023, FY2021–FY2024, FY2022–FY2025 and FY2023–FY2026. Only U.S. Border Patrol and Southwest Land Border are retained, with nine southwest sectors checked. Office of Field Operations, northern border and Other regions are excluded. Within a release, non-overlapping detail records are aggregated; across releases, newer observations take precedence. Releases are never summed together. The TidyTuesday mirror is retained as provenance/fallback only, not an analytical input.
The timeline uses the combined published total throughout, without switching to at-entry-only counts. During March 2020–May 2023, the total combines USBP apprehensions with Title 42 expulsions. Title 42 began March 21, 2020 and ended May 11, 2023; those boundary months combine authorities. Where the split is available, total equals at entry plus at large.
Fiscal October–December maps to fiscal year minus one; January–September maps to fiscal year. Average daily encounters equal the monthly total divided by actual calendar days, including leap-year February. No missing observations are interpolated or zero-filled. The connected published series shows recorded totals; it does not establish historical consistency of the interior component.
The timeline retains numeric y-axis ticks without a unit title; its subtitle specifies daily encounters averaged by month. Its inauguration markers sit at January 20, 2017, 2021 and 2025, with left-aligned presidency labels above them. January monthly averages span administrations. Three callouts identify December 2023, December 2024 and August 2026; December 2024 is 47,320 / 31 = 1,526.45 per day, rounded to 1,526 on the chart. The central decline annotation and horizontal rule have been removed.
The footer’s ports-of-entry exclusion refers to OFO processing, not CBP’s distinct At Entry classification. Both charts state that encounters count events, not unique people, include Title 42 expulsions during March 2020–May 2023, and include recent interior apprehensions whose consistent inclusion in earlier totals is unconfirmed. The timeline footer leaves the inauguration convention to this methodology and its ALT text.
Presidential-term trajectories indexed to starting January
Each monthly index is 100 × monthly average daily published encounters / average daily published encounters in the term’s starting January. Month lengths, including leap-year February, are accounted for before indexing. No annual aggregation, interpolation or forecasts are used. An index of 50 means half the starting January daily rate; 200 means twice that rate.
| Series | Calendar window | Starting January total | Starting January daily rate |
|---|---|---|---|
| Trump · first term | January 2017–December 2020 | 31,576 | 1,018.58 |
| Biden | January 2021–December 2024 | 75,316 | 2,429.55 |
| Trump · second term | January 2025–August 2026 | 29,105 | 938.87 |
January is a practical proxy for the inherited encounter level, not an exact pre-inauguration measure: it includes days under both administrations. Monthly observations cannot isolate the days before January 20. The first two series use four complete calendar years as an approximation to presidential terms; neither includes the following January, which spans administrations.
Month 1 is inauguration-year January, month 12 is December, and month 13 is January of Year 2. Year labels are centered over their respective twelve-month sections. The first two series contain 48 monthly observations each. Trump’s second term ends at month 20, August 2026, at 30.5, or 69.5% below January 2025. Its 28 unobserved months through month 48 remain missing, rather than being stretched or filled.
The first-term peak is 420.7 in May 2019; Biden’s peak is 331.6 in December 2023. December 2020 and December 2024 end at 225.3 and 62.8, respectively. All observed values fit the linear zero-to-470 axis. The subtitle reads “Average daily encounters indexed to each term’s starting January = 100”. The incomplete second-term label explicitly says “(through Aug 2026)”. The reference at 100 marks each term’s starting January. Trump’s first term is crimson and dashed, Biden is brand blue and solid, and Trump’s second term is crimson and solid, with direct endpoint labels.
This chart compares relative changes from different starting levels, not absolute encounter levels or average performance across presidencies. Rounded consistently, the January baselines are 1,019, 2,430 and 939 encounters per day, respectively. Trump’s first term has the higher indexed peak because its starting level was lower, even though Biden’s term had the higher absolute daily peak: 8,056 per day in December 2023, versus 4,286 per day in May 2019. A low baseline can produce a large relative increase. The trajectories do not isolate presidential policy effects, and indexing does not resolve historical interior-component uncertainty. Baseline availability and positivity are checked before division; all three baselines are valid. presidential_term_baselines.csv records the denominators.
The annotation “2019 surge: predominantly Central American families.” describes the composition of the increase, rather than a policy effect. CBP described arriving flows as primarily Central American families and unaccompanied children in its March 2019 briefing; its fiscal 2019 briefing described the increase as driven largely by family units and unaccompanied minors, with families primarily from Central America.
Interior-apprehension scope evidence
The exact month when at-large apprehensions began to be included cannot be established. October 2023 is the earliest verified availability of the entry/large breakdown, not an established change in counting rules. January 2017–September 2023 interior composition remains unknown; those totals must not be assumed to exclude interior apprehensions.
The official FY2024 monthly table gives October 2023 southwest total 188,749 = 186,062 at entry + 2,687 at large. All 12 months match the October 2024 final AOR release and current release. The FY2025 monthly table and current table extend that exact reconciliation through August 2026: 35 months in total. Inclusion is therefore demonstrable in historical releases, not a newly introduced FY2026 addition.
The January 2024 early release has October–December 2023 totals 29, 6 and 45 above the later finalized totals. These are release revisions, not evidence of an inclusion-rule change.
CBP defines at entry by whether someone who entered without admission has reached their destination, with no elapsed-time limit. At large includes people already at their destination and legally admitted people who overstayed. At entry is a USBP classification, not OFO activity at an official port. At-entry events may occur inland or after the crossing month. Removing at large does not turn the remainder into measured border crossings.
The linked CBP September 2023 dictionary supplies no entry/large dimension, historical interior-exclusion rule or dated inclusion change. The separate DHS OHSS KHSM dictionary describes a different report/schema and cannot establish a counting change in this CBP dataset.
The separate at-entry series from October 2023 onward supports a sensitivity check within the verified split window, subject to revisions and undocumented implementation changes. Its comparability with earlier unsplit totals cannot be established. It remains separate in processed data and the scope audit. Both main charts instead follow published totals and display the historical-scope caveat.
Validation and reproducibility
Validation confirms 116/116 published-total observations, zero duplicates/missing chart counts, 35/35 total = entry + large matches, 3/3 starting January indices exactly 100, correct 48/48/20 monthly term alignment and endpoints, six independent count/day index checks, leap-year February divisors, and 28 missing future second-term indices. The y-axis contains every calculated index. Raw detail keys are unique, counts are nonnegative integers, sector/component/geography and Title 42 checks pass. FY2017–FY2018 HTML matches 24 PDF monthly observations; fiscal totals and FY2020 HTML/CSV match. Successive final-release overlaps agree, with early-release revisions recorded separately.
Charts use established Lato weights, white backgrounds and The Data Decoded branding. Both PNGs are rendered directly at 3,000 × 3,000 pixels, 400 dpi, on 7.5 × 7.5-inch square canvases, with matching SVG compositions. Full-size, 1,000-pixel and 375-pixel previews support layout inspection. The timeline is presented first, followed by the presidential-term index; the rejected annual overlays have no active chart references. Detailed evidence is in narrative/scope-evidence.md; every verified monthly total/entry difference is in data/processed/scope_monthly_differences.csv and narrative/monthly-scope-differences.md. The index is in data/processed/presidential_term_index.csv, and the supporting classification in data/processed/at_entry_sensitivity.csv. Raw snapshots, dates and hashes are recorded in the manifest. The article is published on The Data Decoded website.