
Perceived levels of public sector corruption in the U.S. and Somalia
Corruption Perceptions Index (CPI) in the U.S. and Somalia (2012–2024)
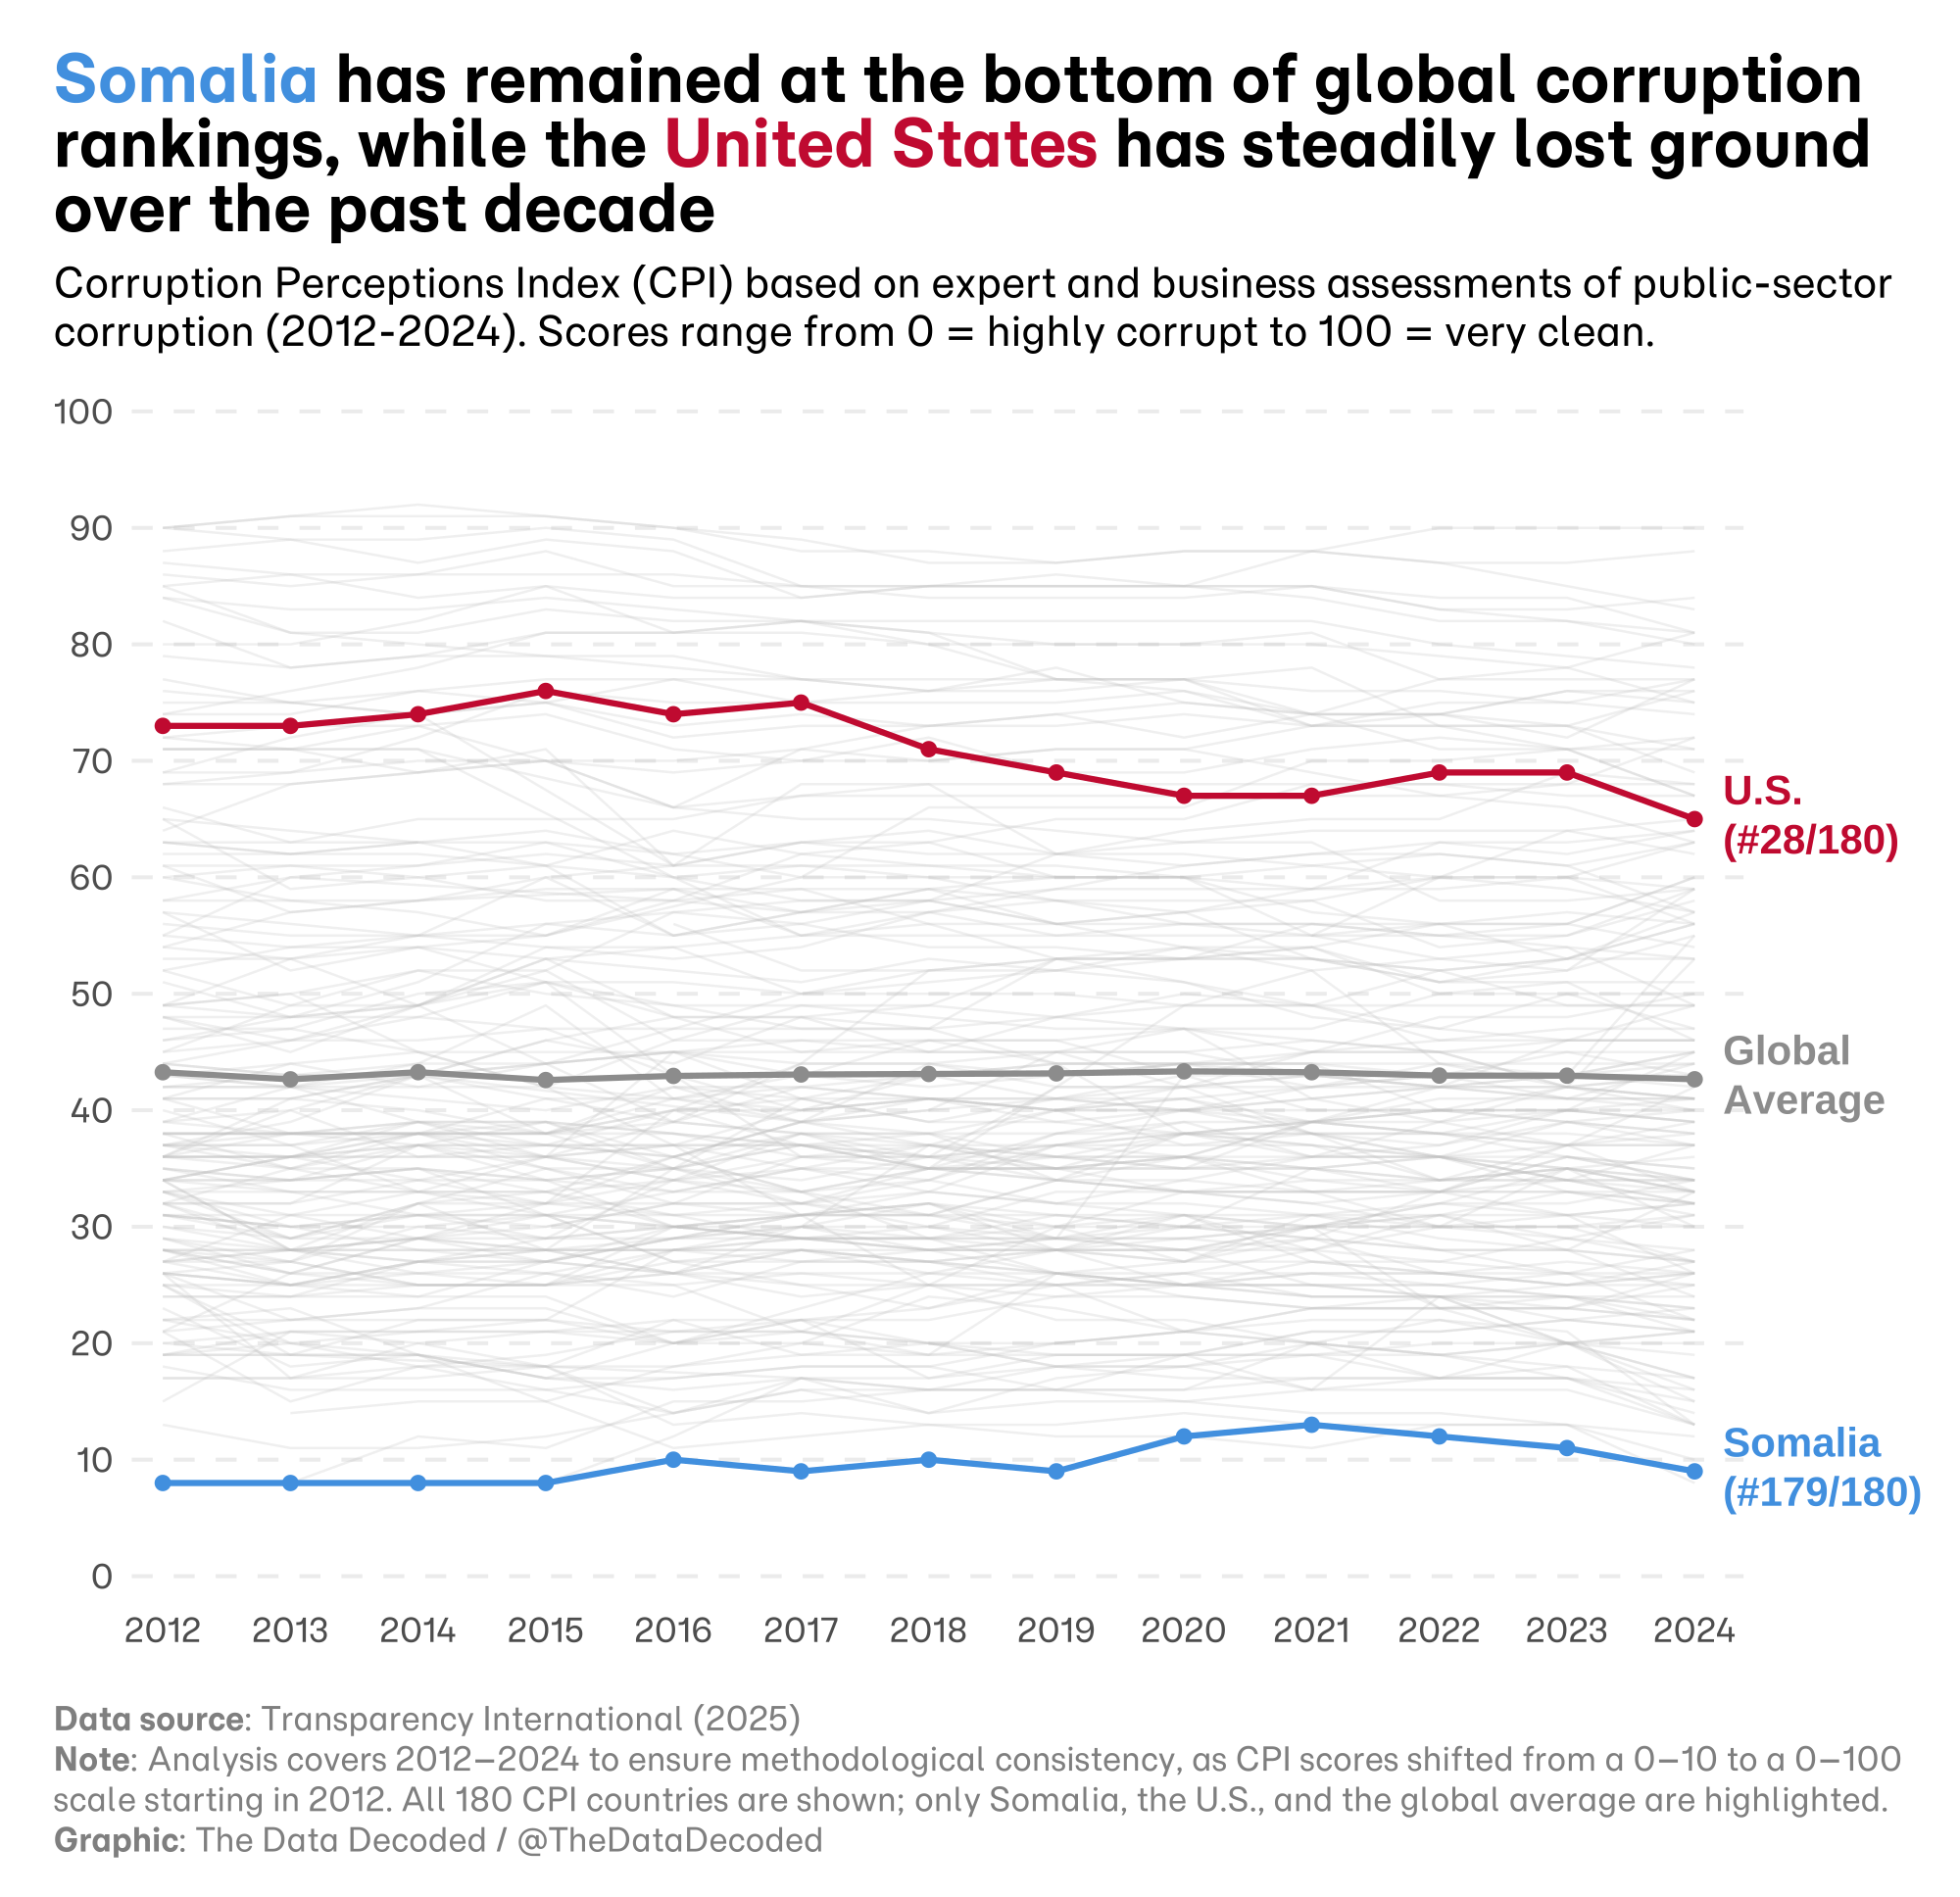
This chart follows the U.S. and Somalia on the Corruption Perceptions Index from 2012 to 2024, alongside the global average and other countries. Scores run from 0, perceived as highly corrupt, to 100, perceived as very clean.
Sources and methodology
The source is Transparency International's CPI. The chart uses 2012–2024 for consistency after the index changed from a 0–10 to a 0–100 scale. It displays all 180 countries in grey and highlights Somalia, the U.S., and the global average. The original Quarto analysis contains the data processing and plotting steps.