
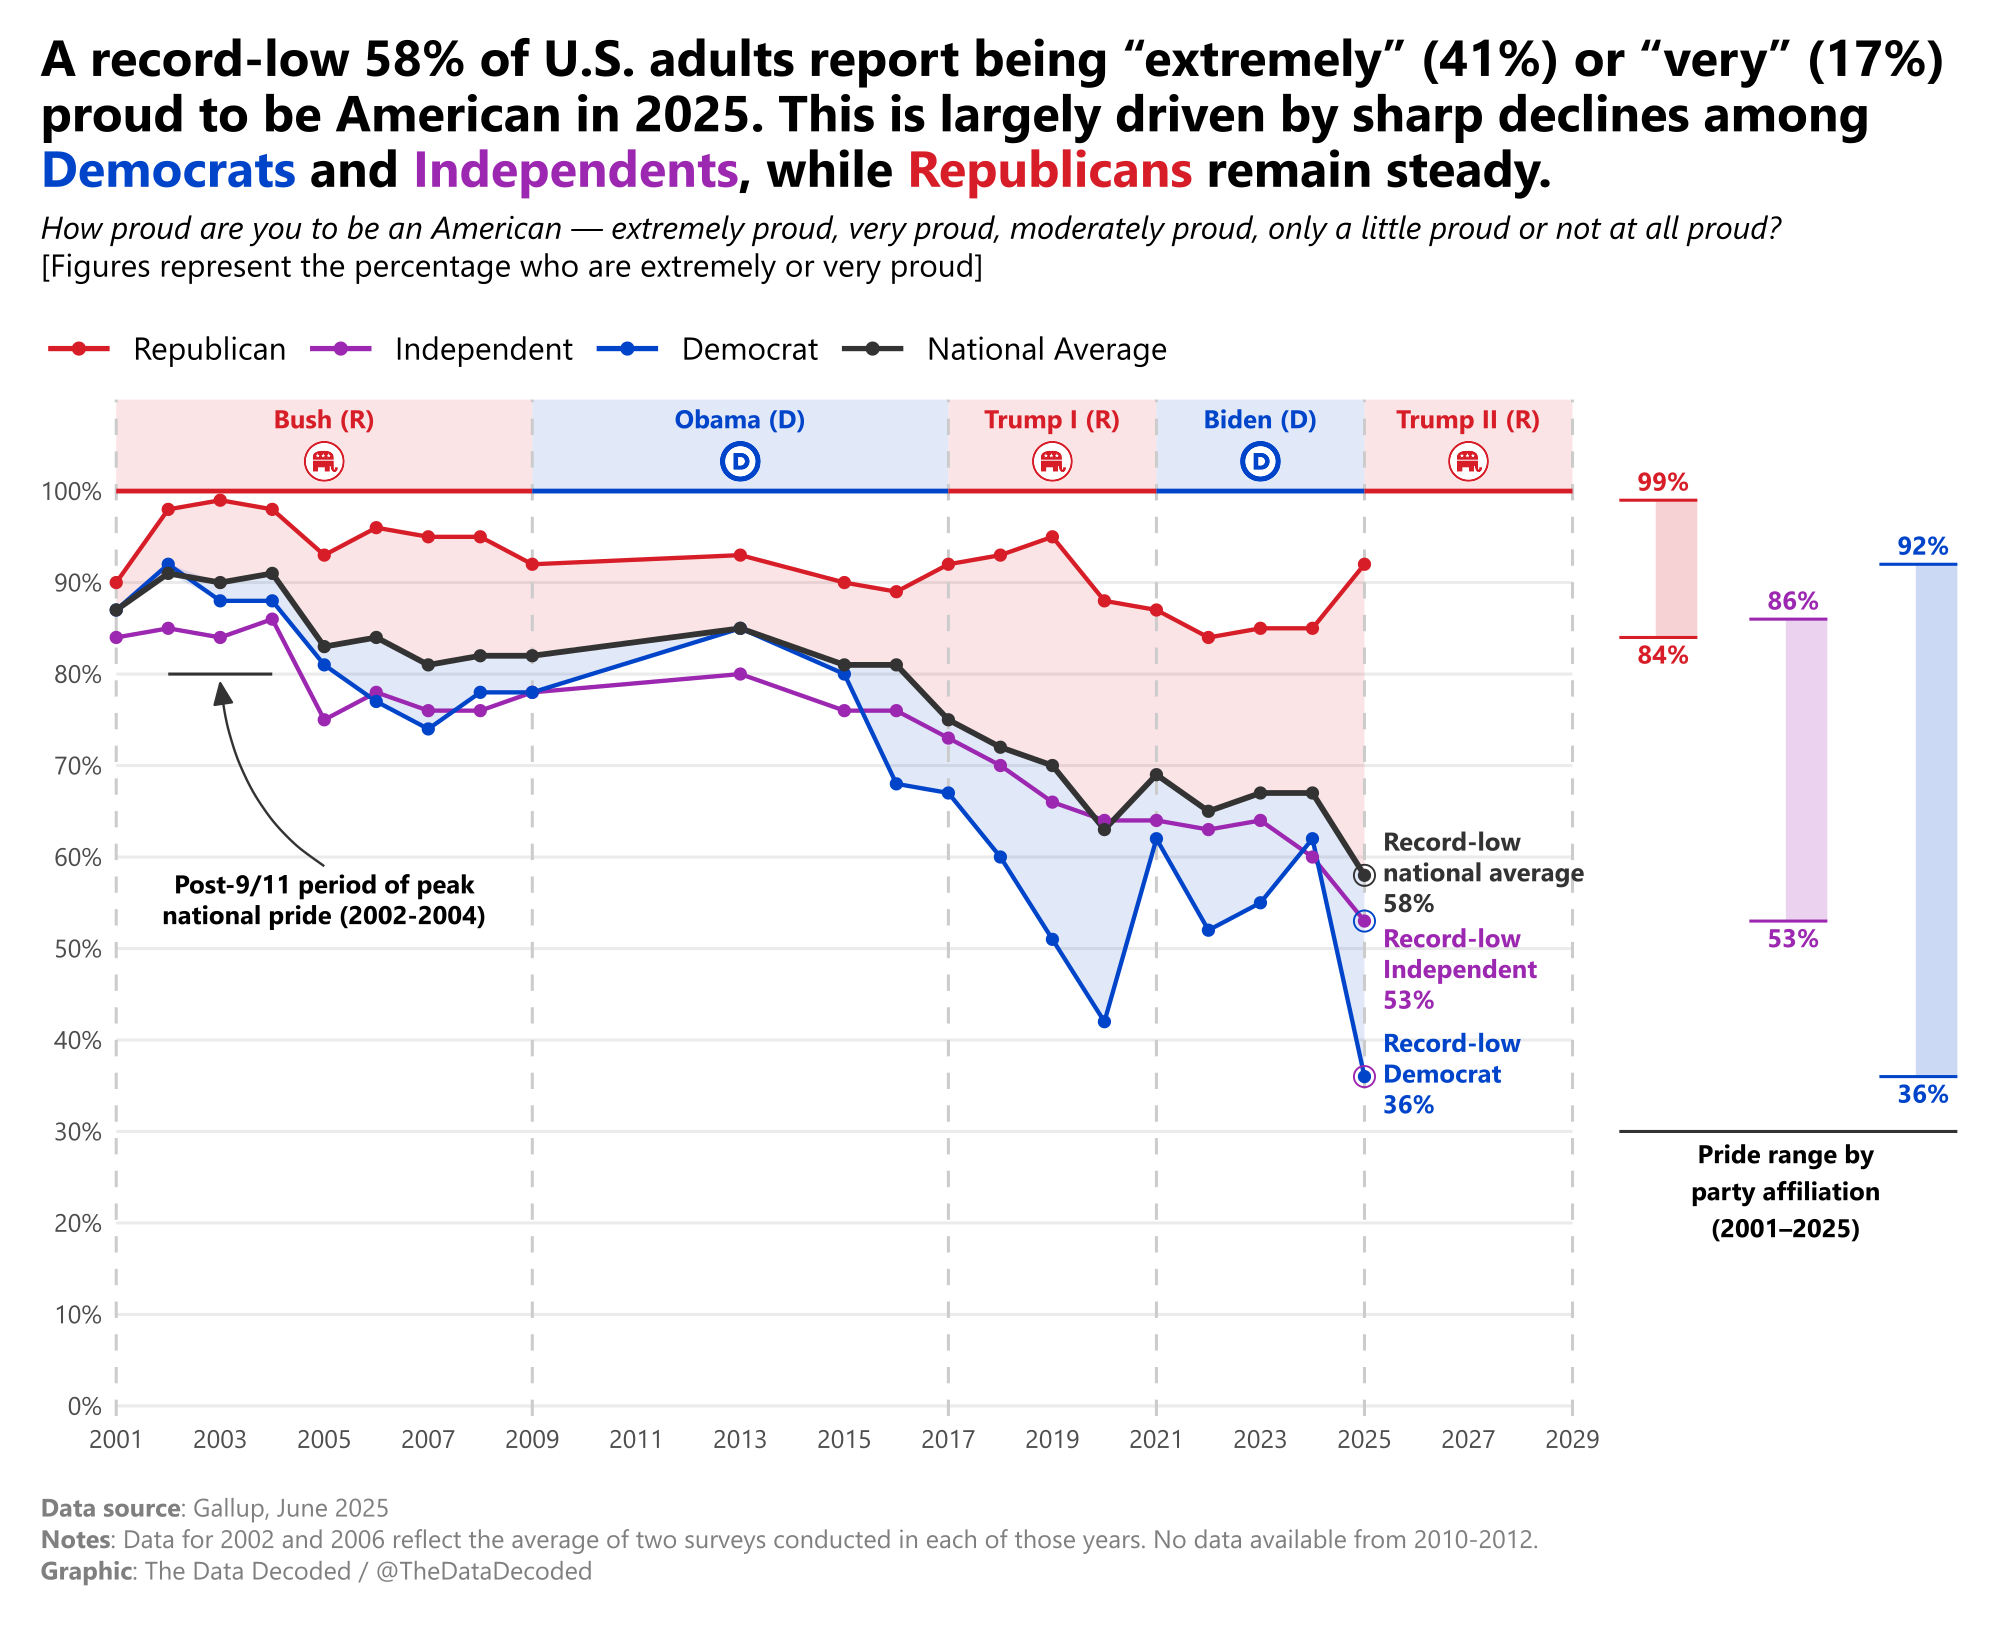
Evolution of U.S. national pride by political affiliation over the past 25 years
Gallup poll (2001-2025)
The chart tracks the share of U.S. adults who say they are extremely or very proud to be American, comparing Democrats, Republicans, independents, and the national average from 2001 to 2025.
Sources and methodology
The source is Gallup polling through June 2025. The chart combines the “extremely” and “very” proud responses. The original note says the values for 2002 and 2006 average two surveys in each year and that data are unavailable for 2010–2012. The original Quarto analysis contains the series preparation and chart construction.