
Where in the U.S. do most foreign-born nationals live?
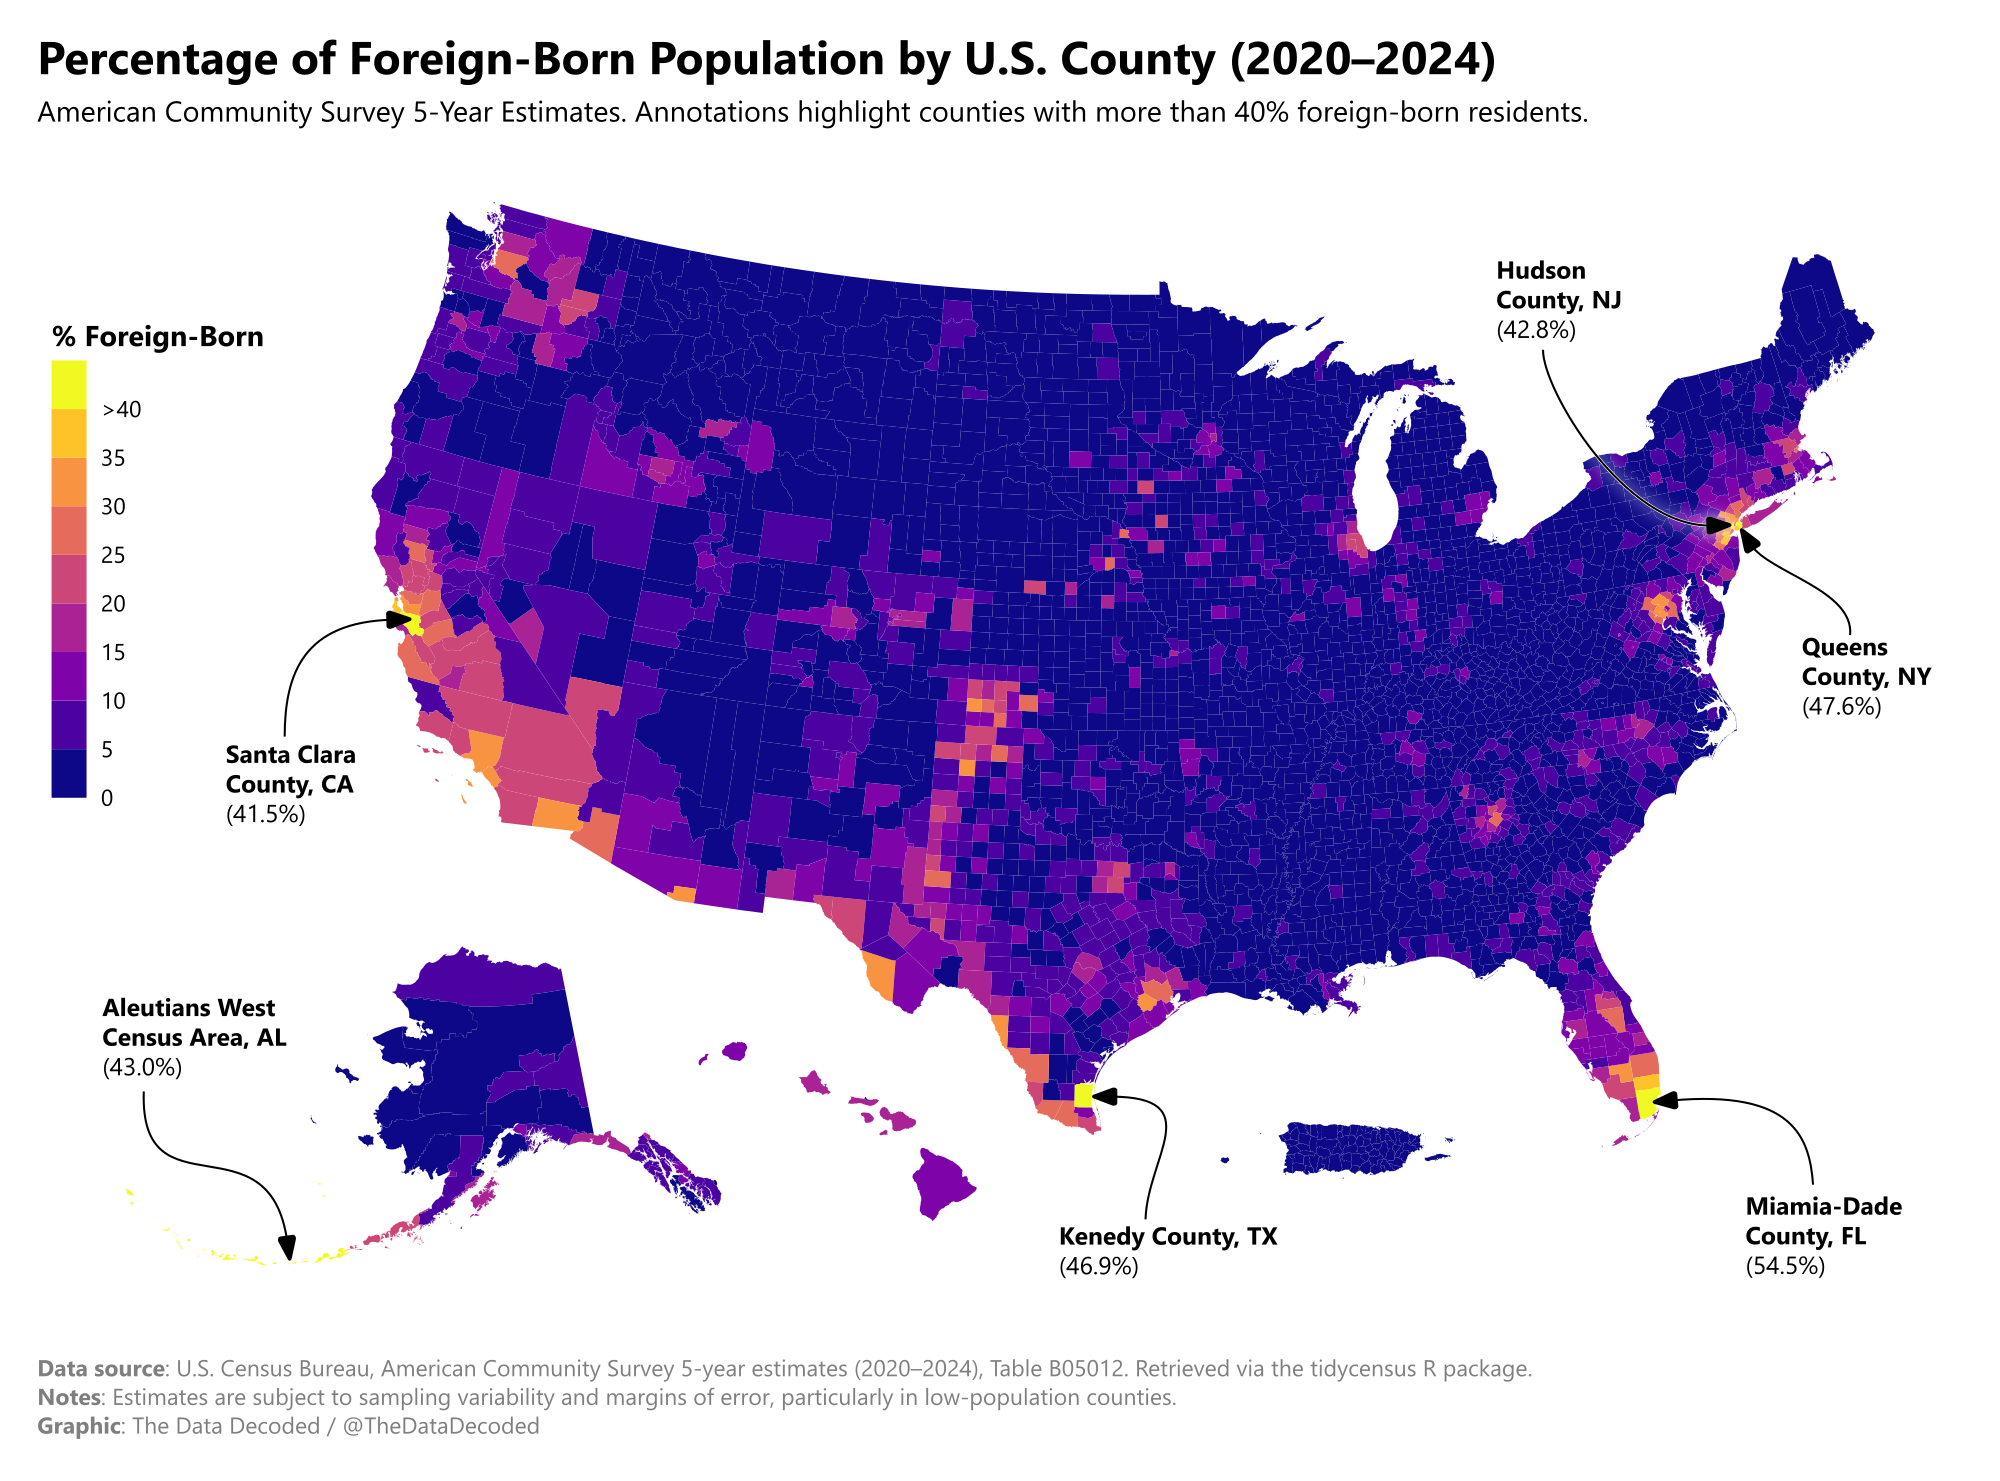
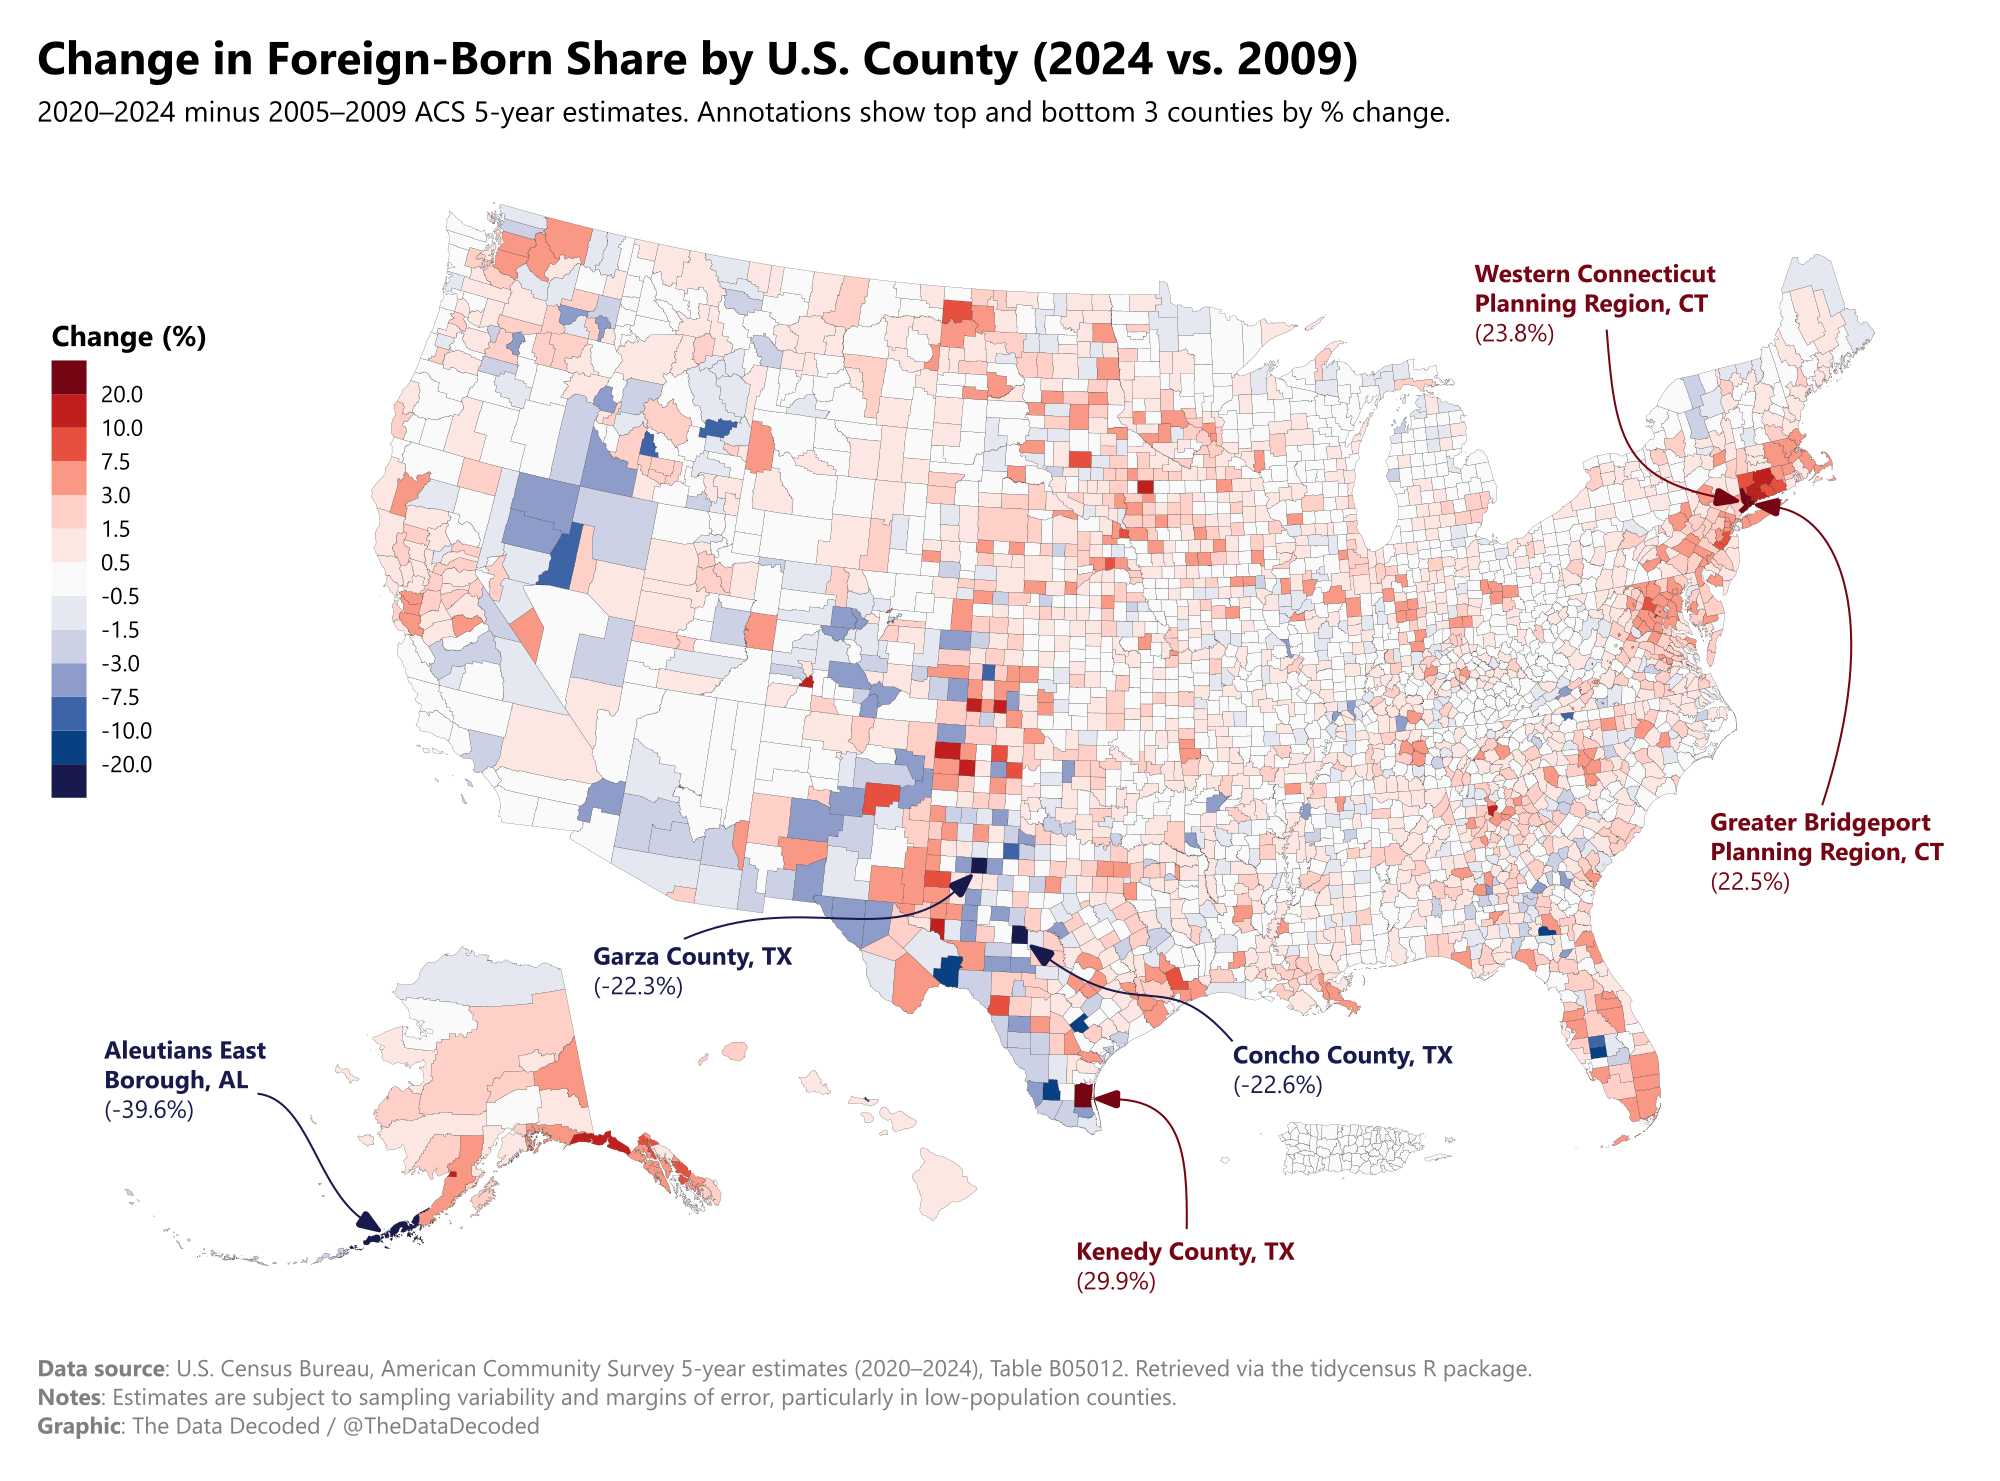
Share of foreign-born nationals by U.S. county and change from 2009 to 2024
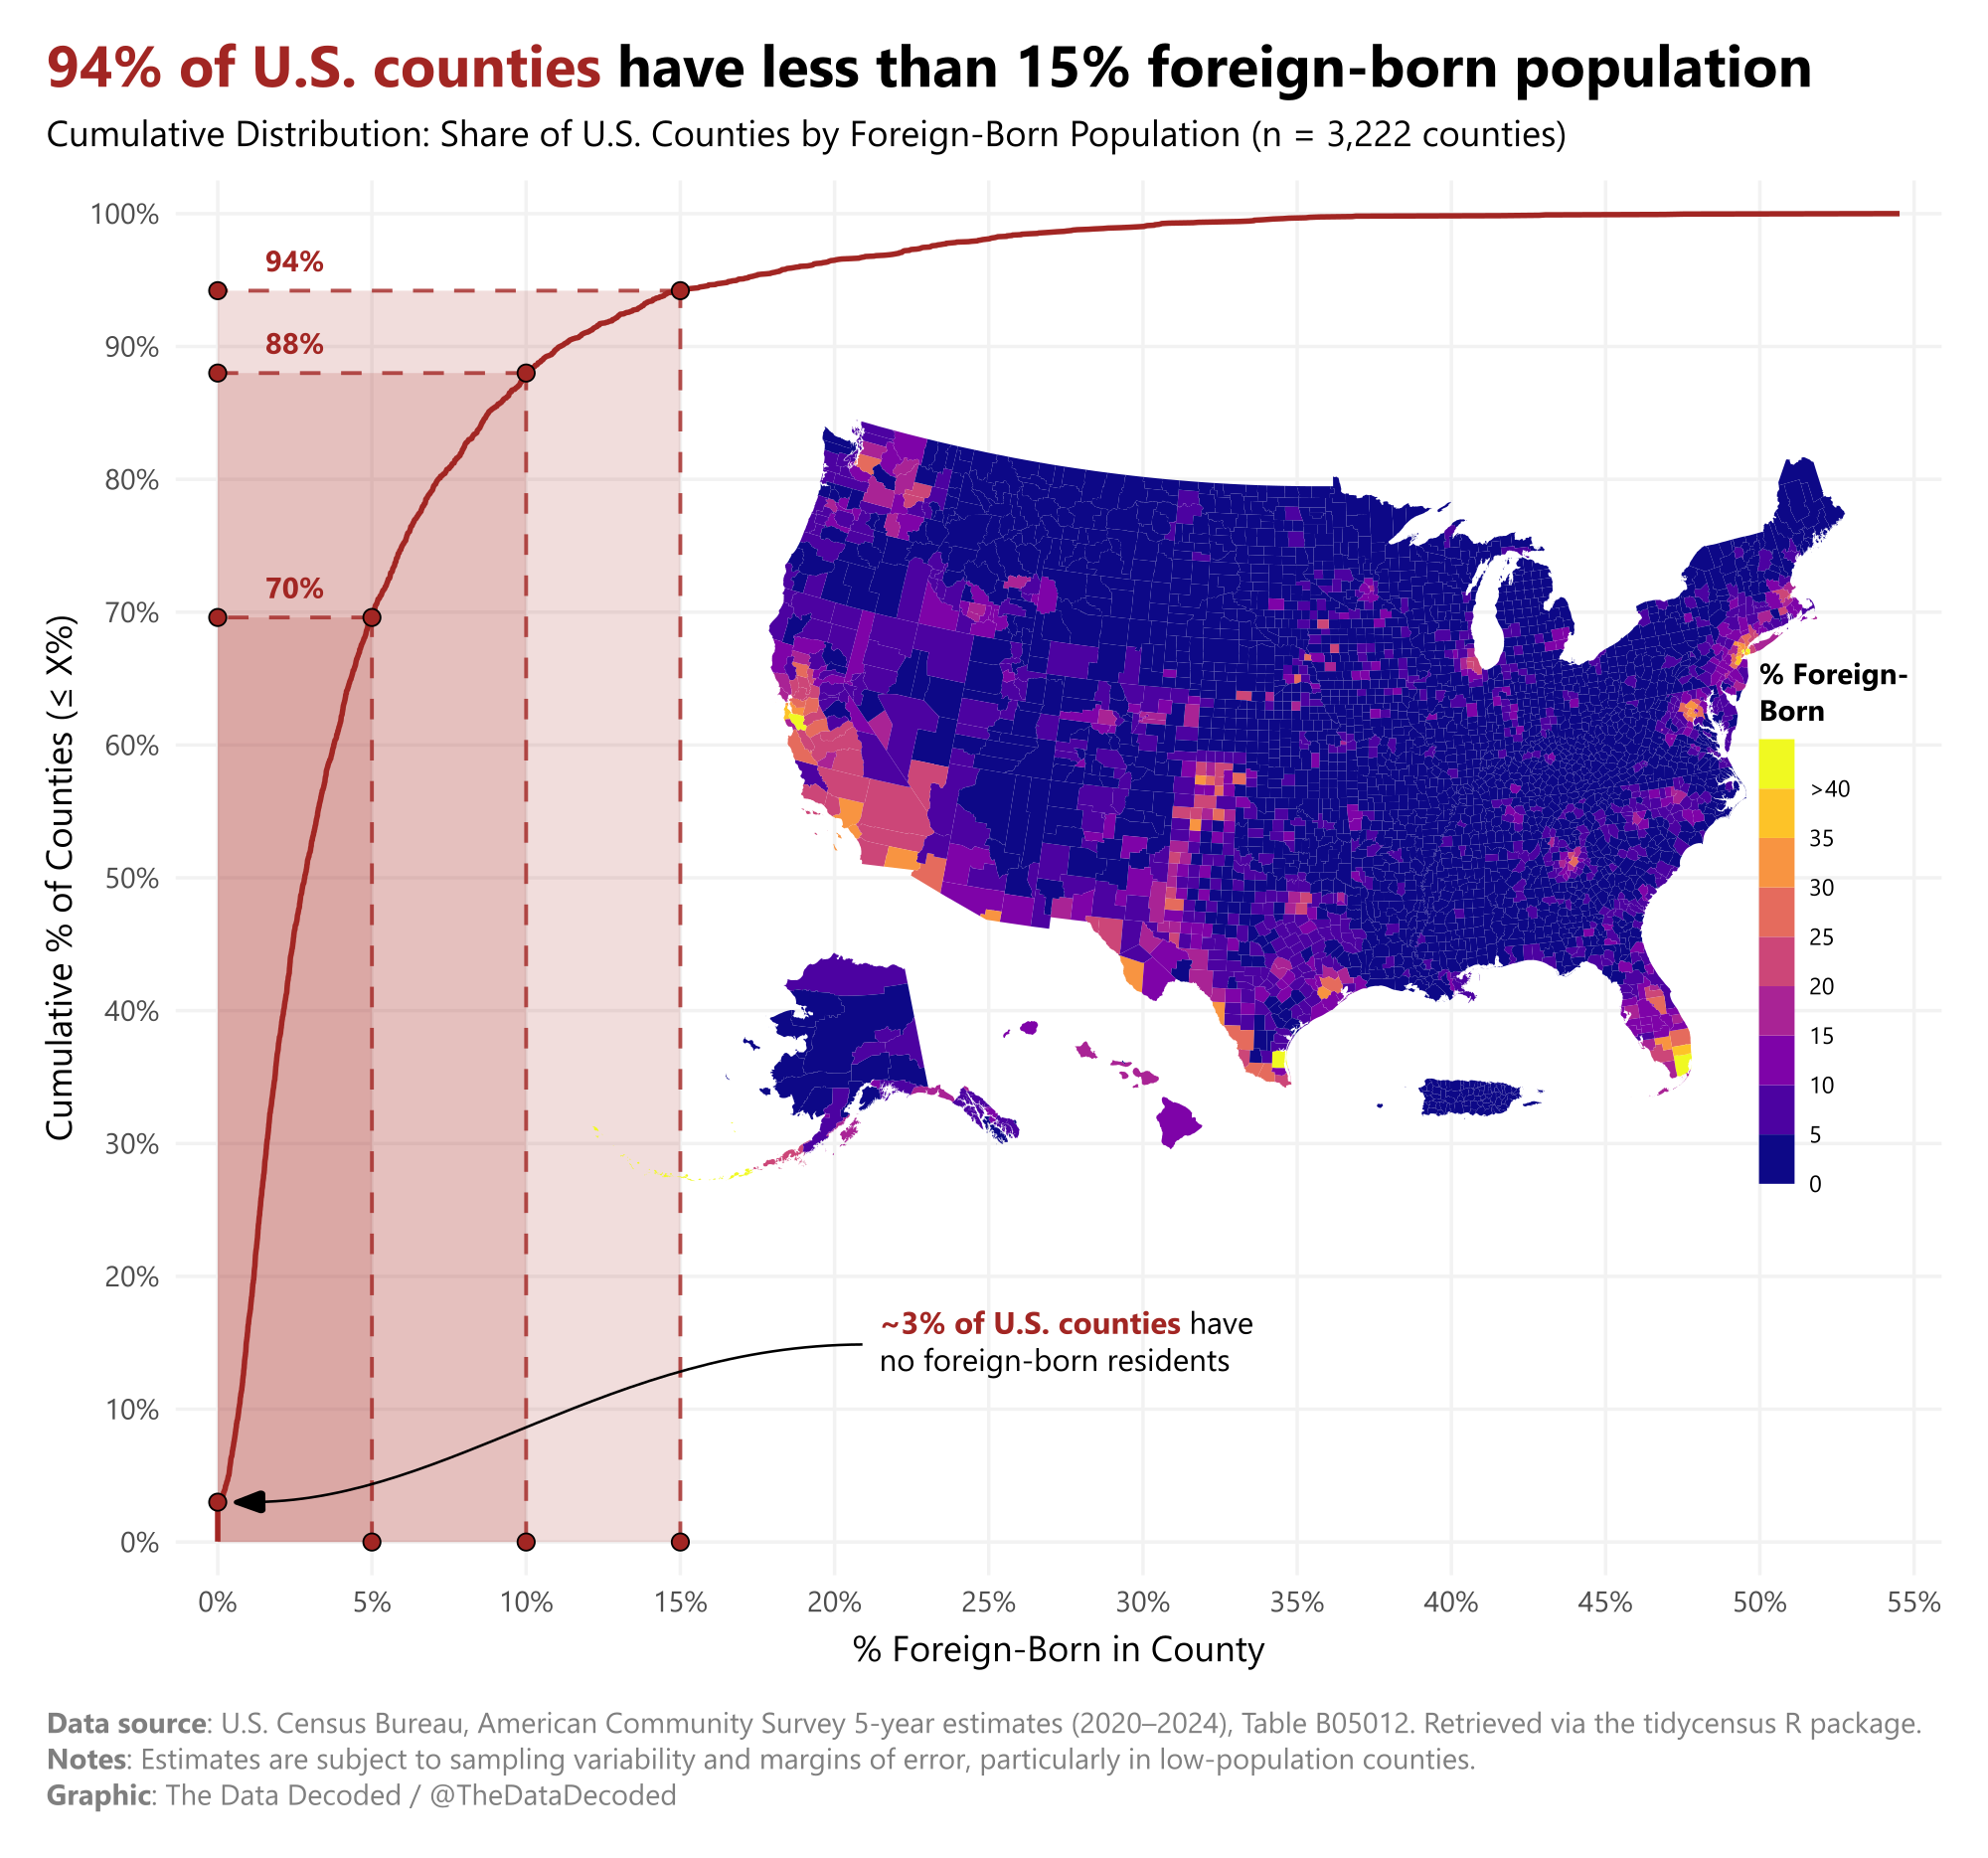
The maps show where foreign-born residents live by county and how county shares changed over the period covered by the analysis. The third chart looks at how the foreign-born population is distributed across counties.
Sources and methodology
The source is the U.S. Census Bureau's American Community Survey five-year estimates, including table B05012, retrieved with tidycensus. The original chart notes that estimates have sampling variability and margins of error, especially in counties with smaller populations. The original Quarto analysis contains the county calculations and map preparation.