
Switzerland’s Housing Vacancy Rate: National Cycles and Cantonal Differences
Switzerland’s housing vacancy rate has fallen since 2020, but the national figure masks wide differences between cantons.
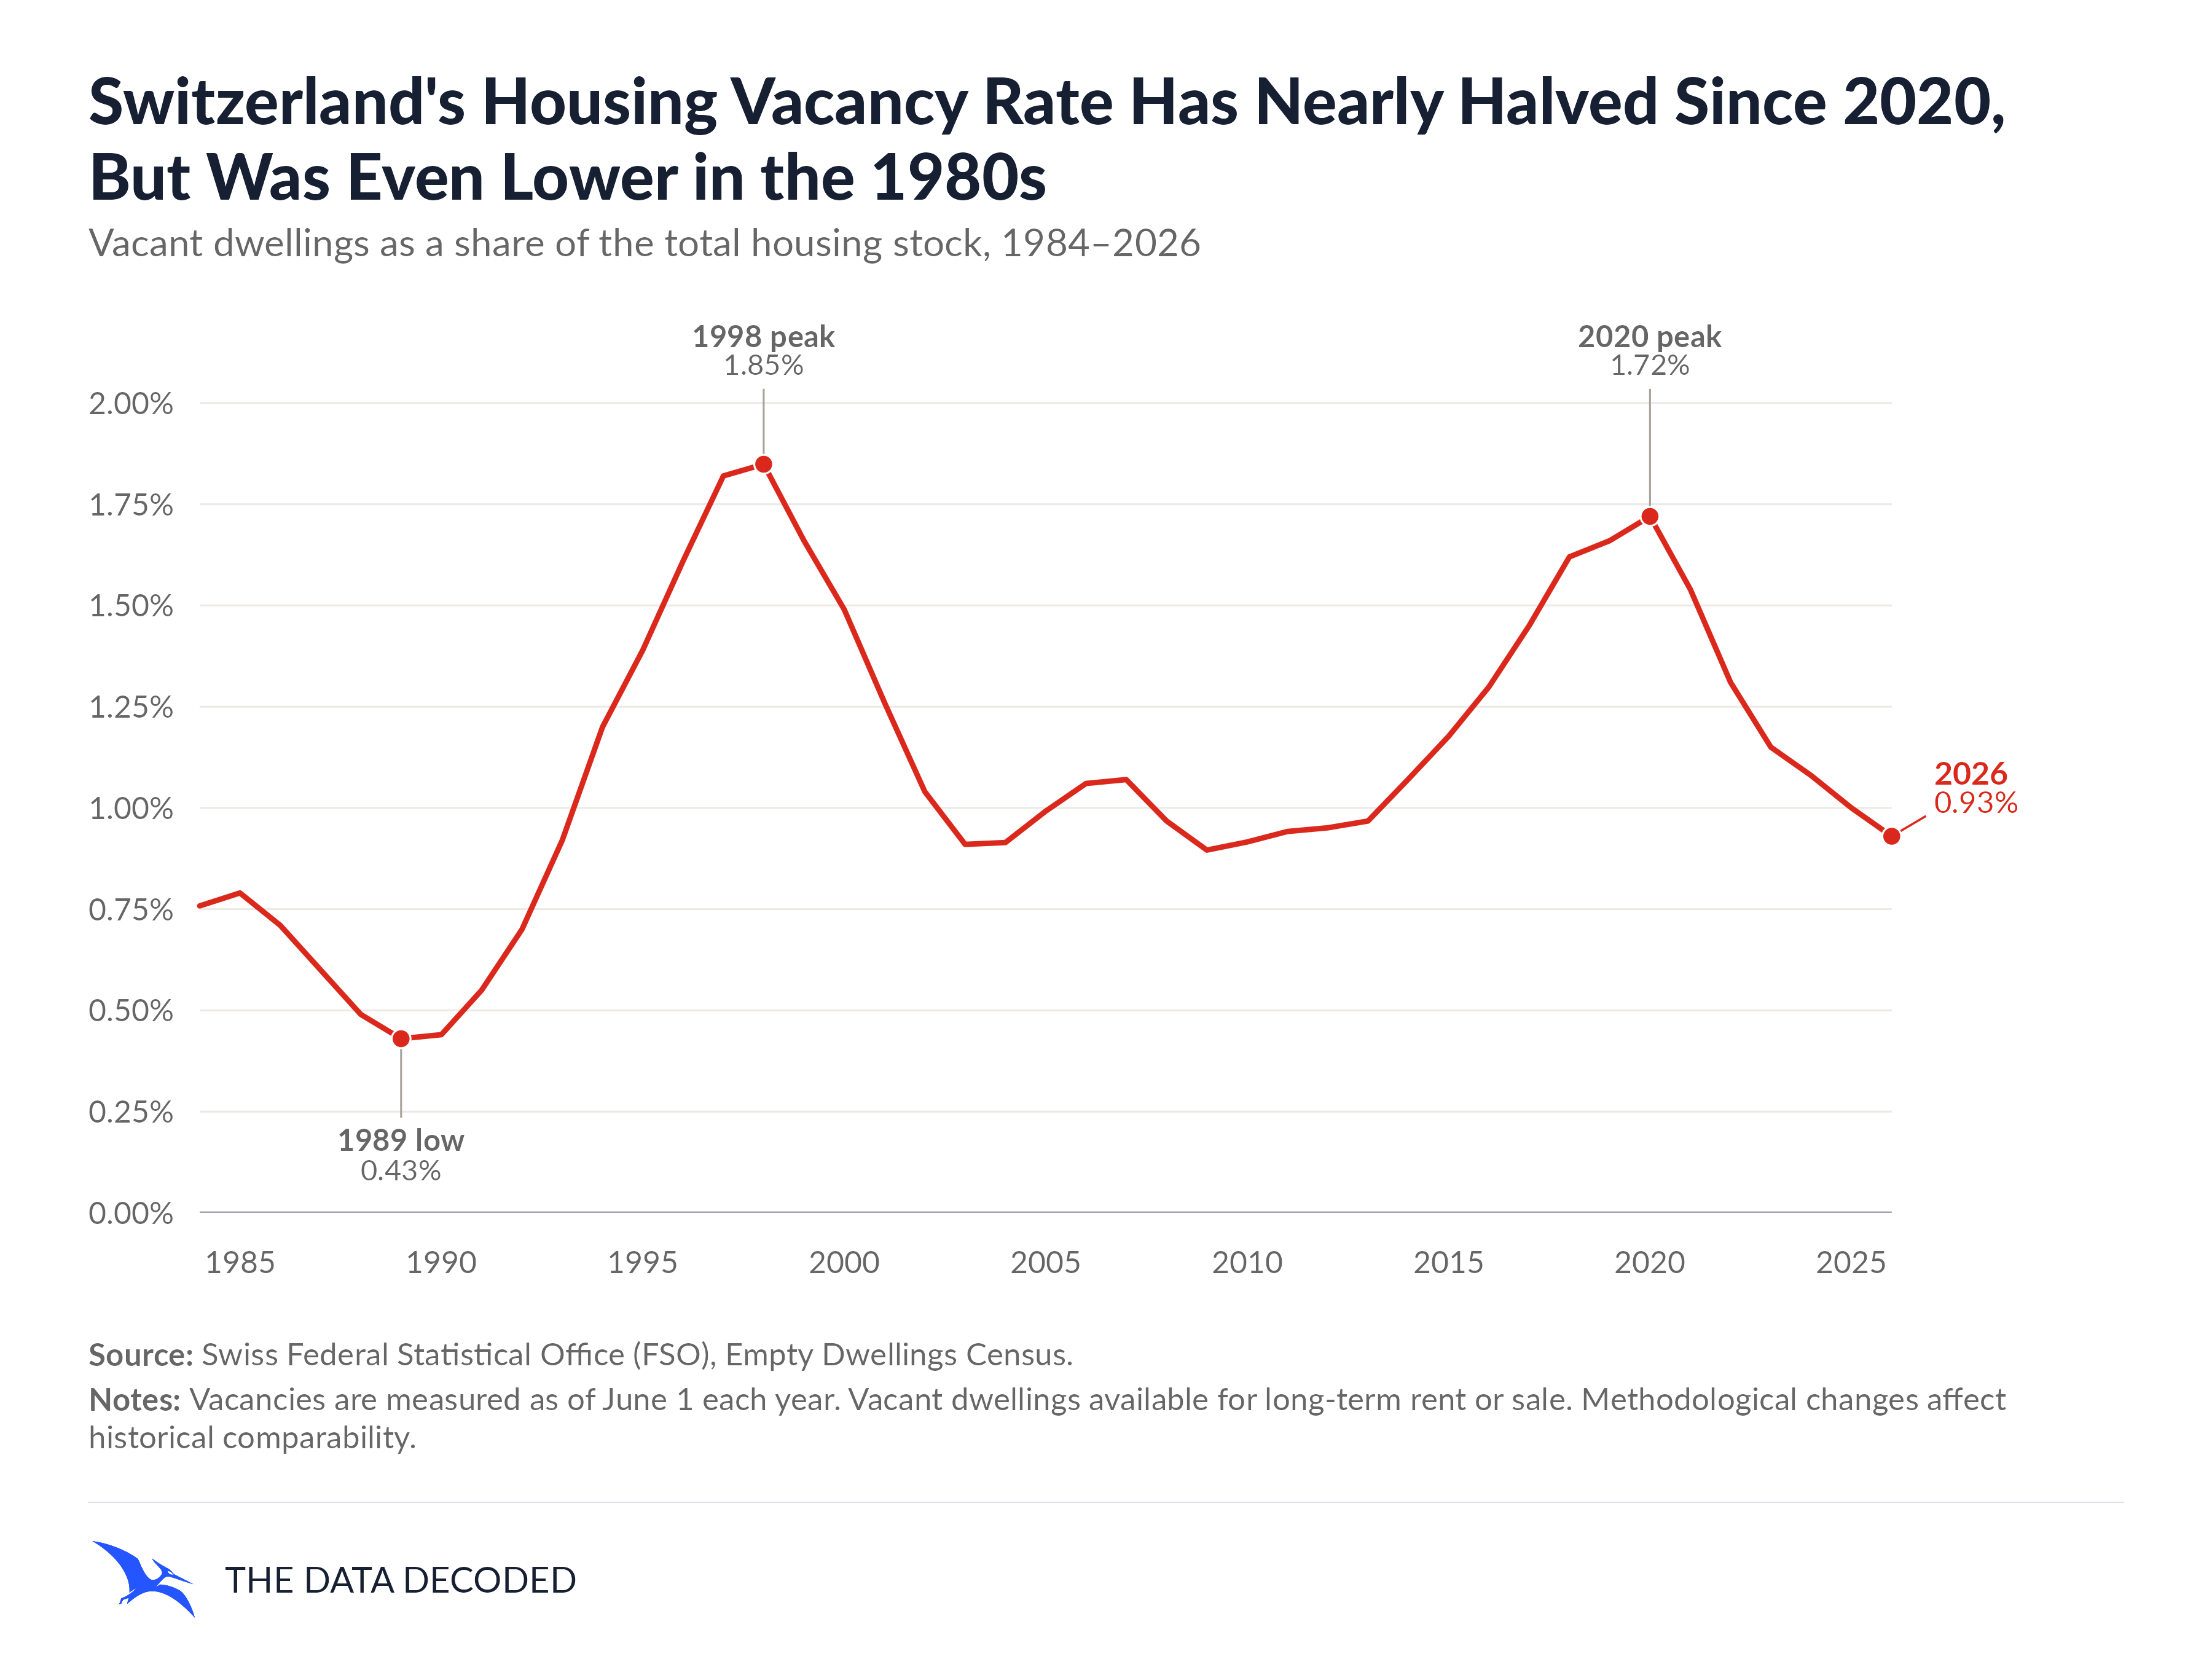
Switzerland’s dwelling vacancy rate fell from 1.72% in 2020 to 0.93% in 2026—a decline of 46%, or 0.79 percentage points. But the national picture hides both a longer history of changing vacancy levels and wide differences between cantons.
Two cycles in the national rate
In 1989, 0.43% of dwellings were vacant, less than half the 2026 rate. The national rate then climbed to 1.85% in 1998 before falling below 1% in the early 2000s. It rose again during the 2010s, reaching 1.72% in 2020, and fell in each of the six years that followed.
These are snapshots of dwellings available for rent or sale, rather than a measure of everyone’s experience of finding a home. The earlier low also comes with a qualification: changes to the census definition and housing-stock denominator affect comparisons across the full period.
A wide cantonal gap
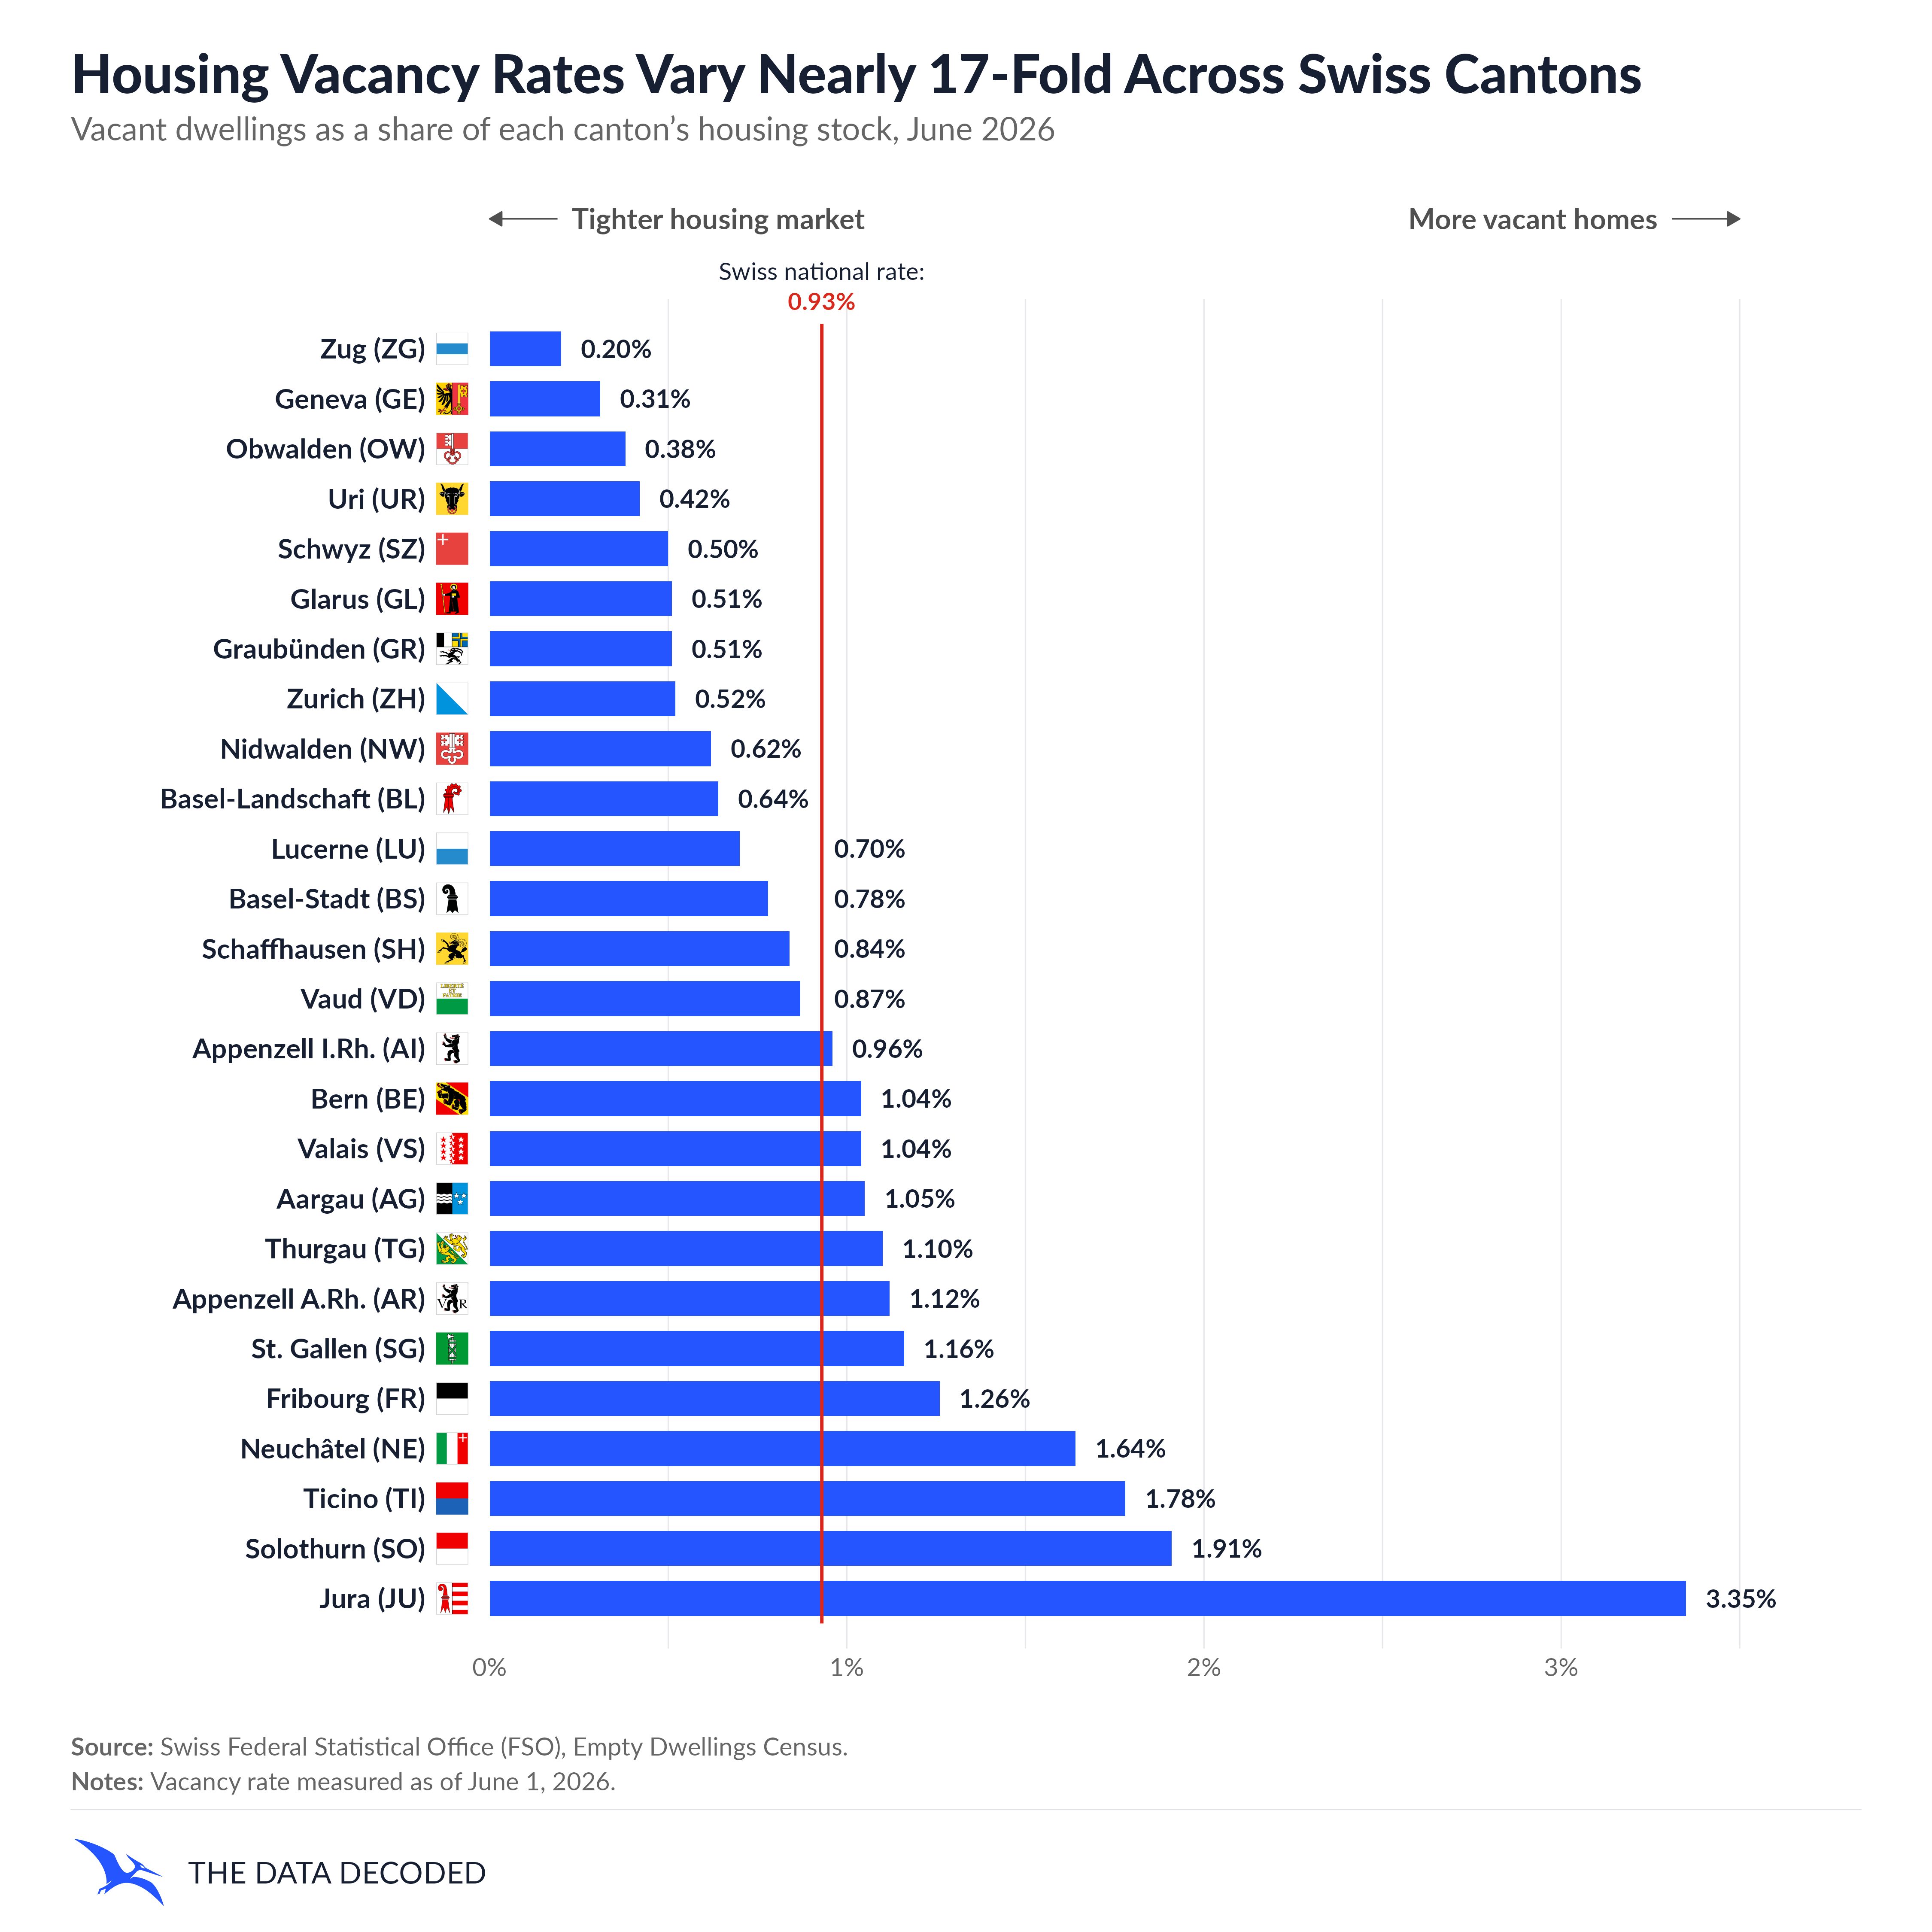
In June 2026, Zug had the lowest vacancy rate at 0.20%, followed by Geneva at 0.31% and Obwalden at 0.38%. Jura had the highest, at 3.35%—nearly 17 times Zug’s rate. Solothurn and Ticino were also among the cantons with higher rates. The national figure of 0.93% is a useful reference, but it does not describe every local market.
A widespread decline since 2020
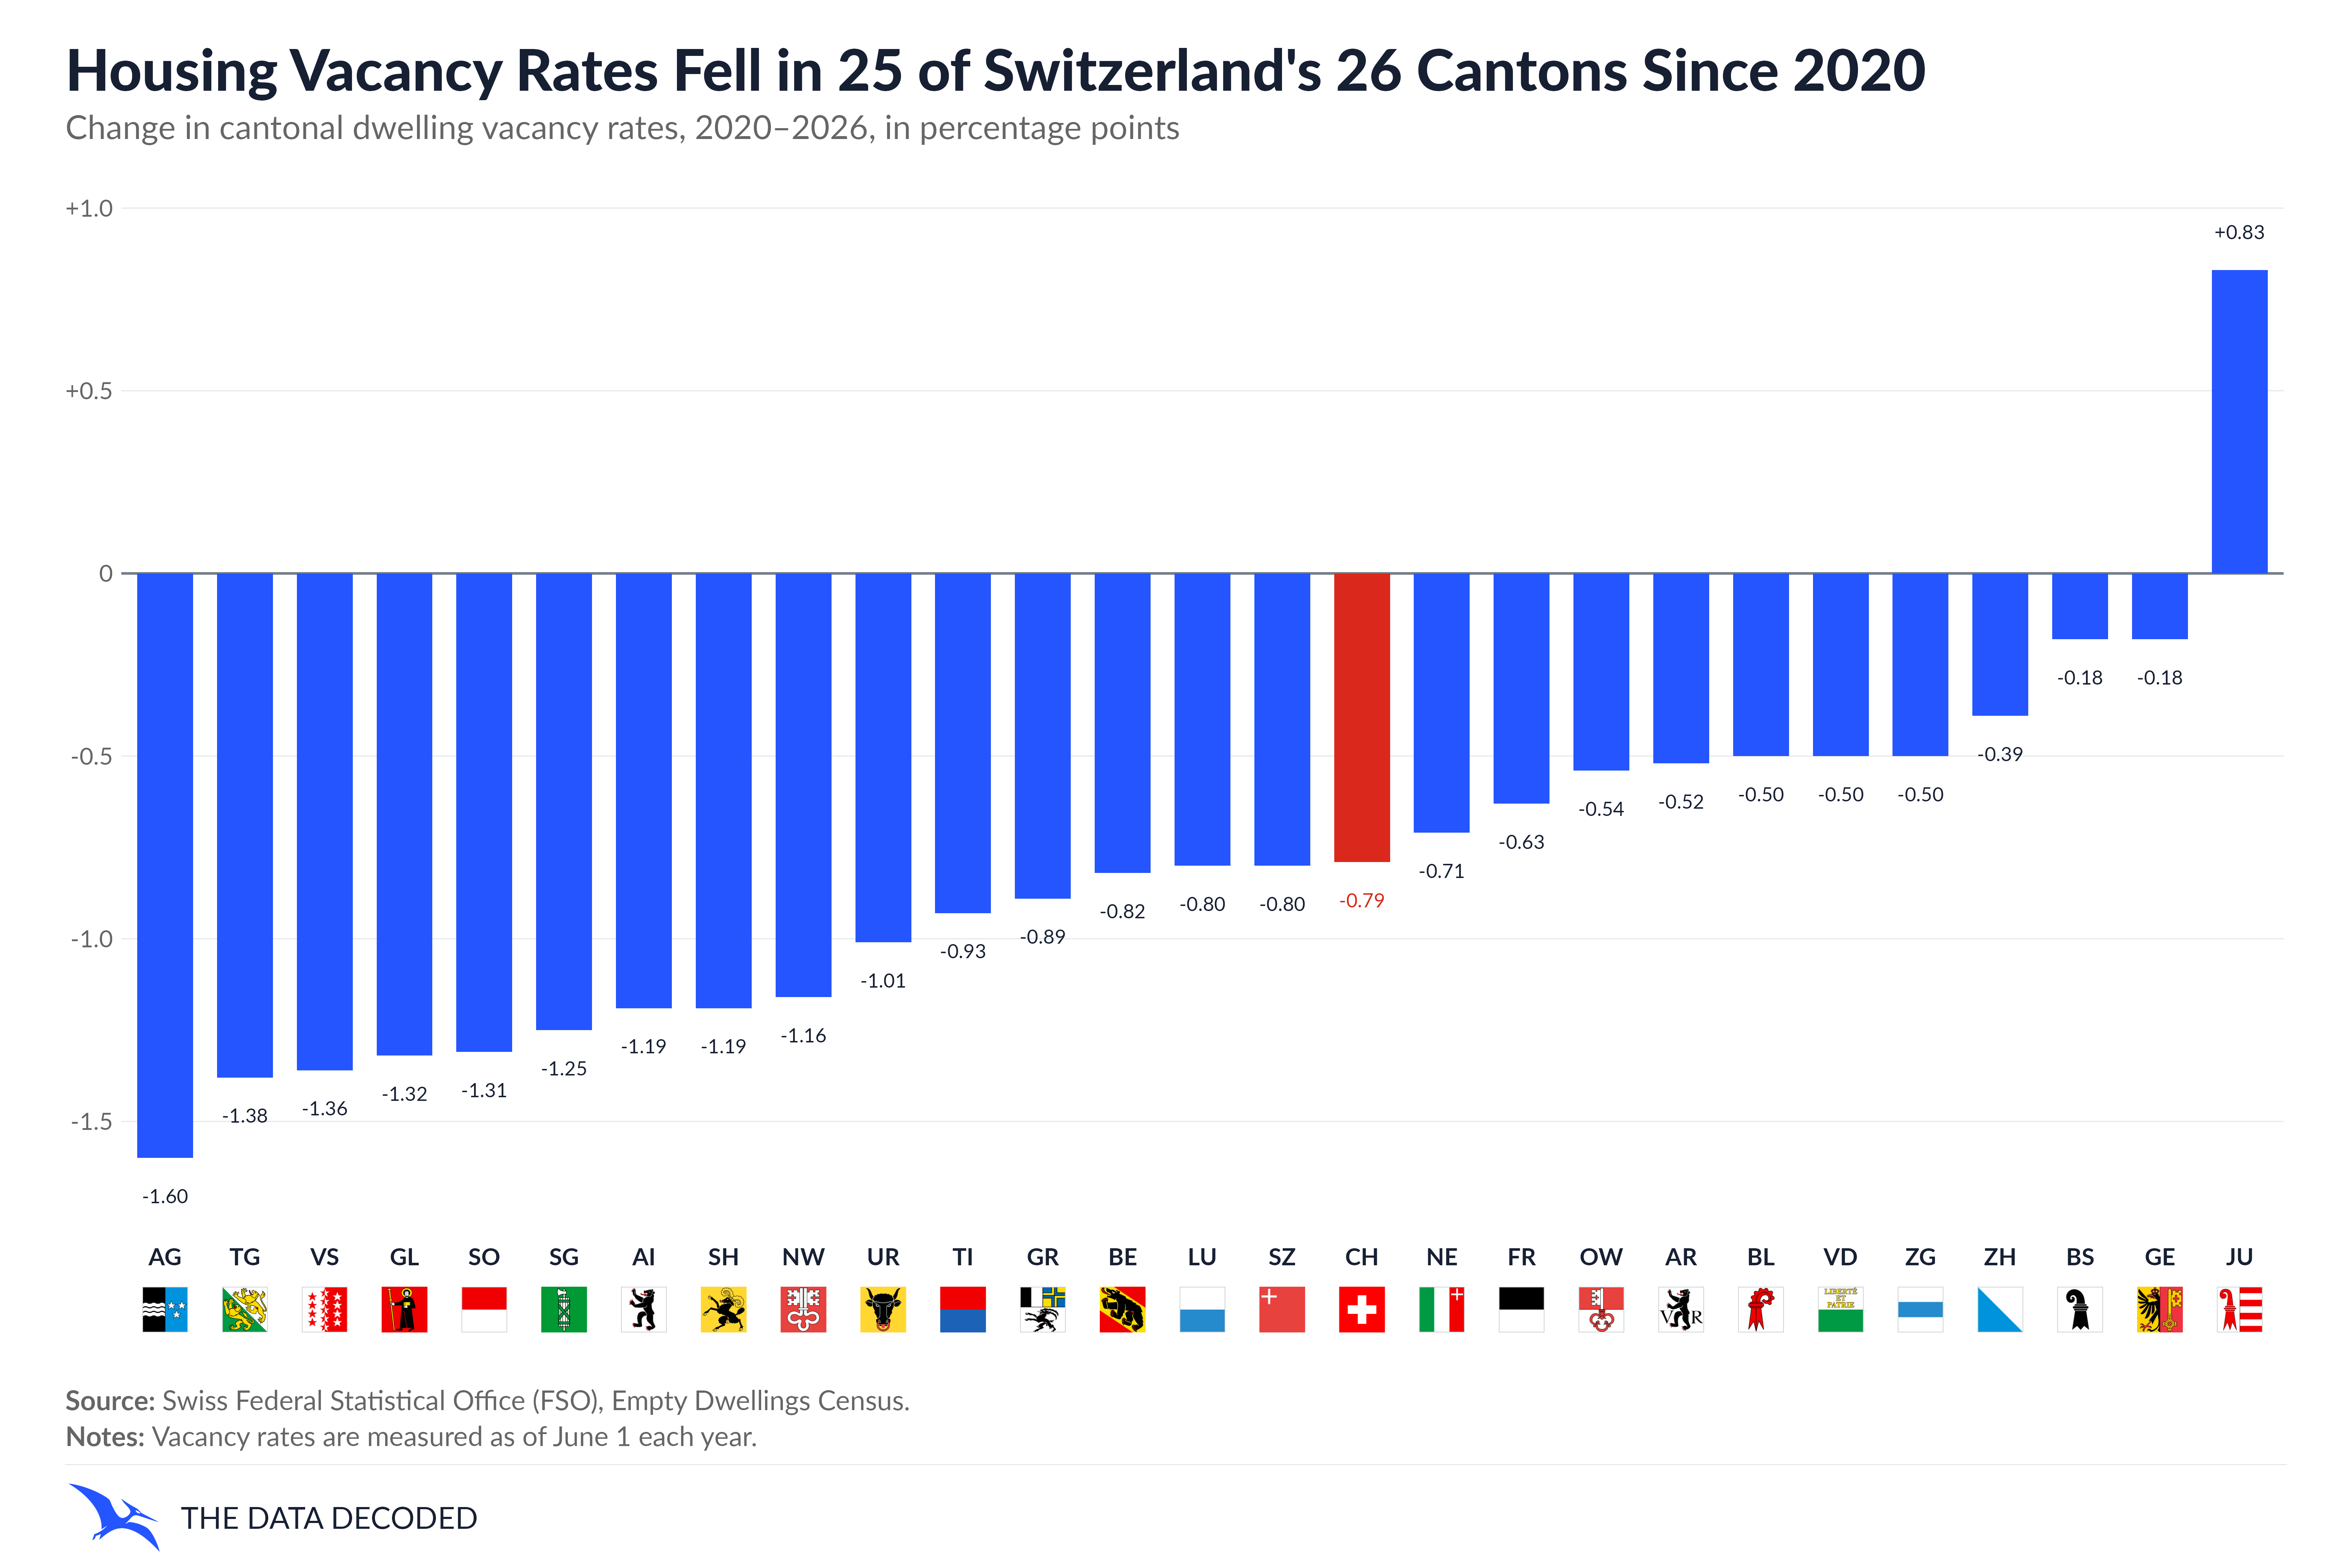
Vacancy rates fell in 25 of Switzerland’s 26 cantons between 2020 and 2026. Aargau recorded the largest decline, at 1.60 percentage points, followed by Thurgau (1.38 points) and Valais (1.36 points). Jura was the exception, rising by 0.83 percentage points. These are differences between rates, expressed in percentage points, rather than relative percentage changes.
The final chart puts those endpoints in a longer context. It compares each canton’s annual series with the national rate from 1999 to 2026, using the same vertical scale for all 26 panels. The grey ribbon shows the gap between each canton and the national rate; its width and direction change as the two series move.
Sources and methodology
The charts use the Swiss Federal Statistical Office’s Empty Dwellings Census: the national historical table, annual cantonal table, and five-year cantonal comparison table. Vacancy rates measure the share of the relevant housing stock that was vacant on June 1 and offered for sale or for rent for at least three months. The national rate is based on the national housing stock; it is not an unweighted average of the 26 cantonal rates.
The national chart covers 1984–2026. The complete published cantonal rate series used here starts in 1999. For overlapping canton tables, the project uses the most recent available revisions; figures are shown to two decimal places. Since 1994 the census has also included furnished dwellings offered for long-term rent. The housing-stock denominator changed around 2010, and some historical observations were revised, so comparisons across the full series require care. The national workbook’s denominator footnotes overlap at 2010, leaving the exact transition boundary ambiguous. See the FSO methodology and the project’s README for details.