
Why Europe travels together: the drivers behind the July–August peak across the continent's short-term rental markets
An analysis of occupancy data from Europe's top 25 largest short-term rental markets in 2024
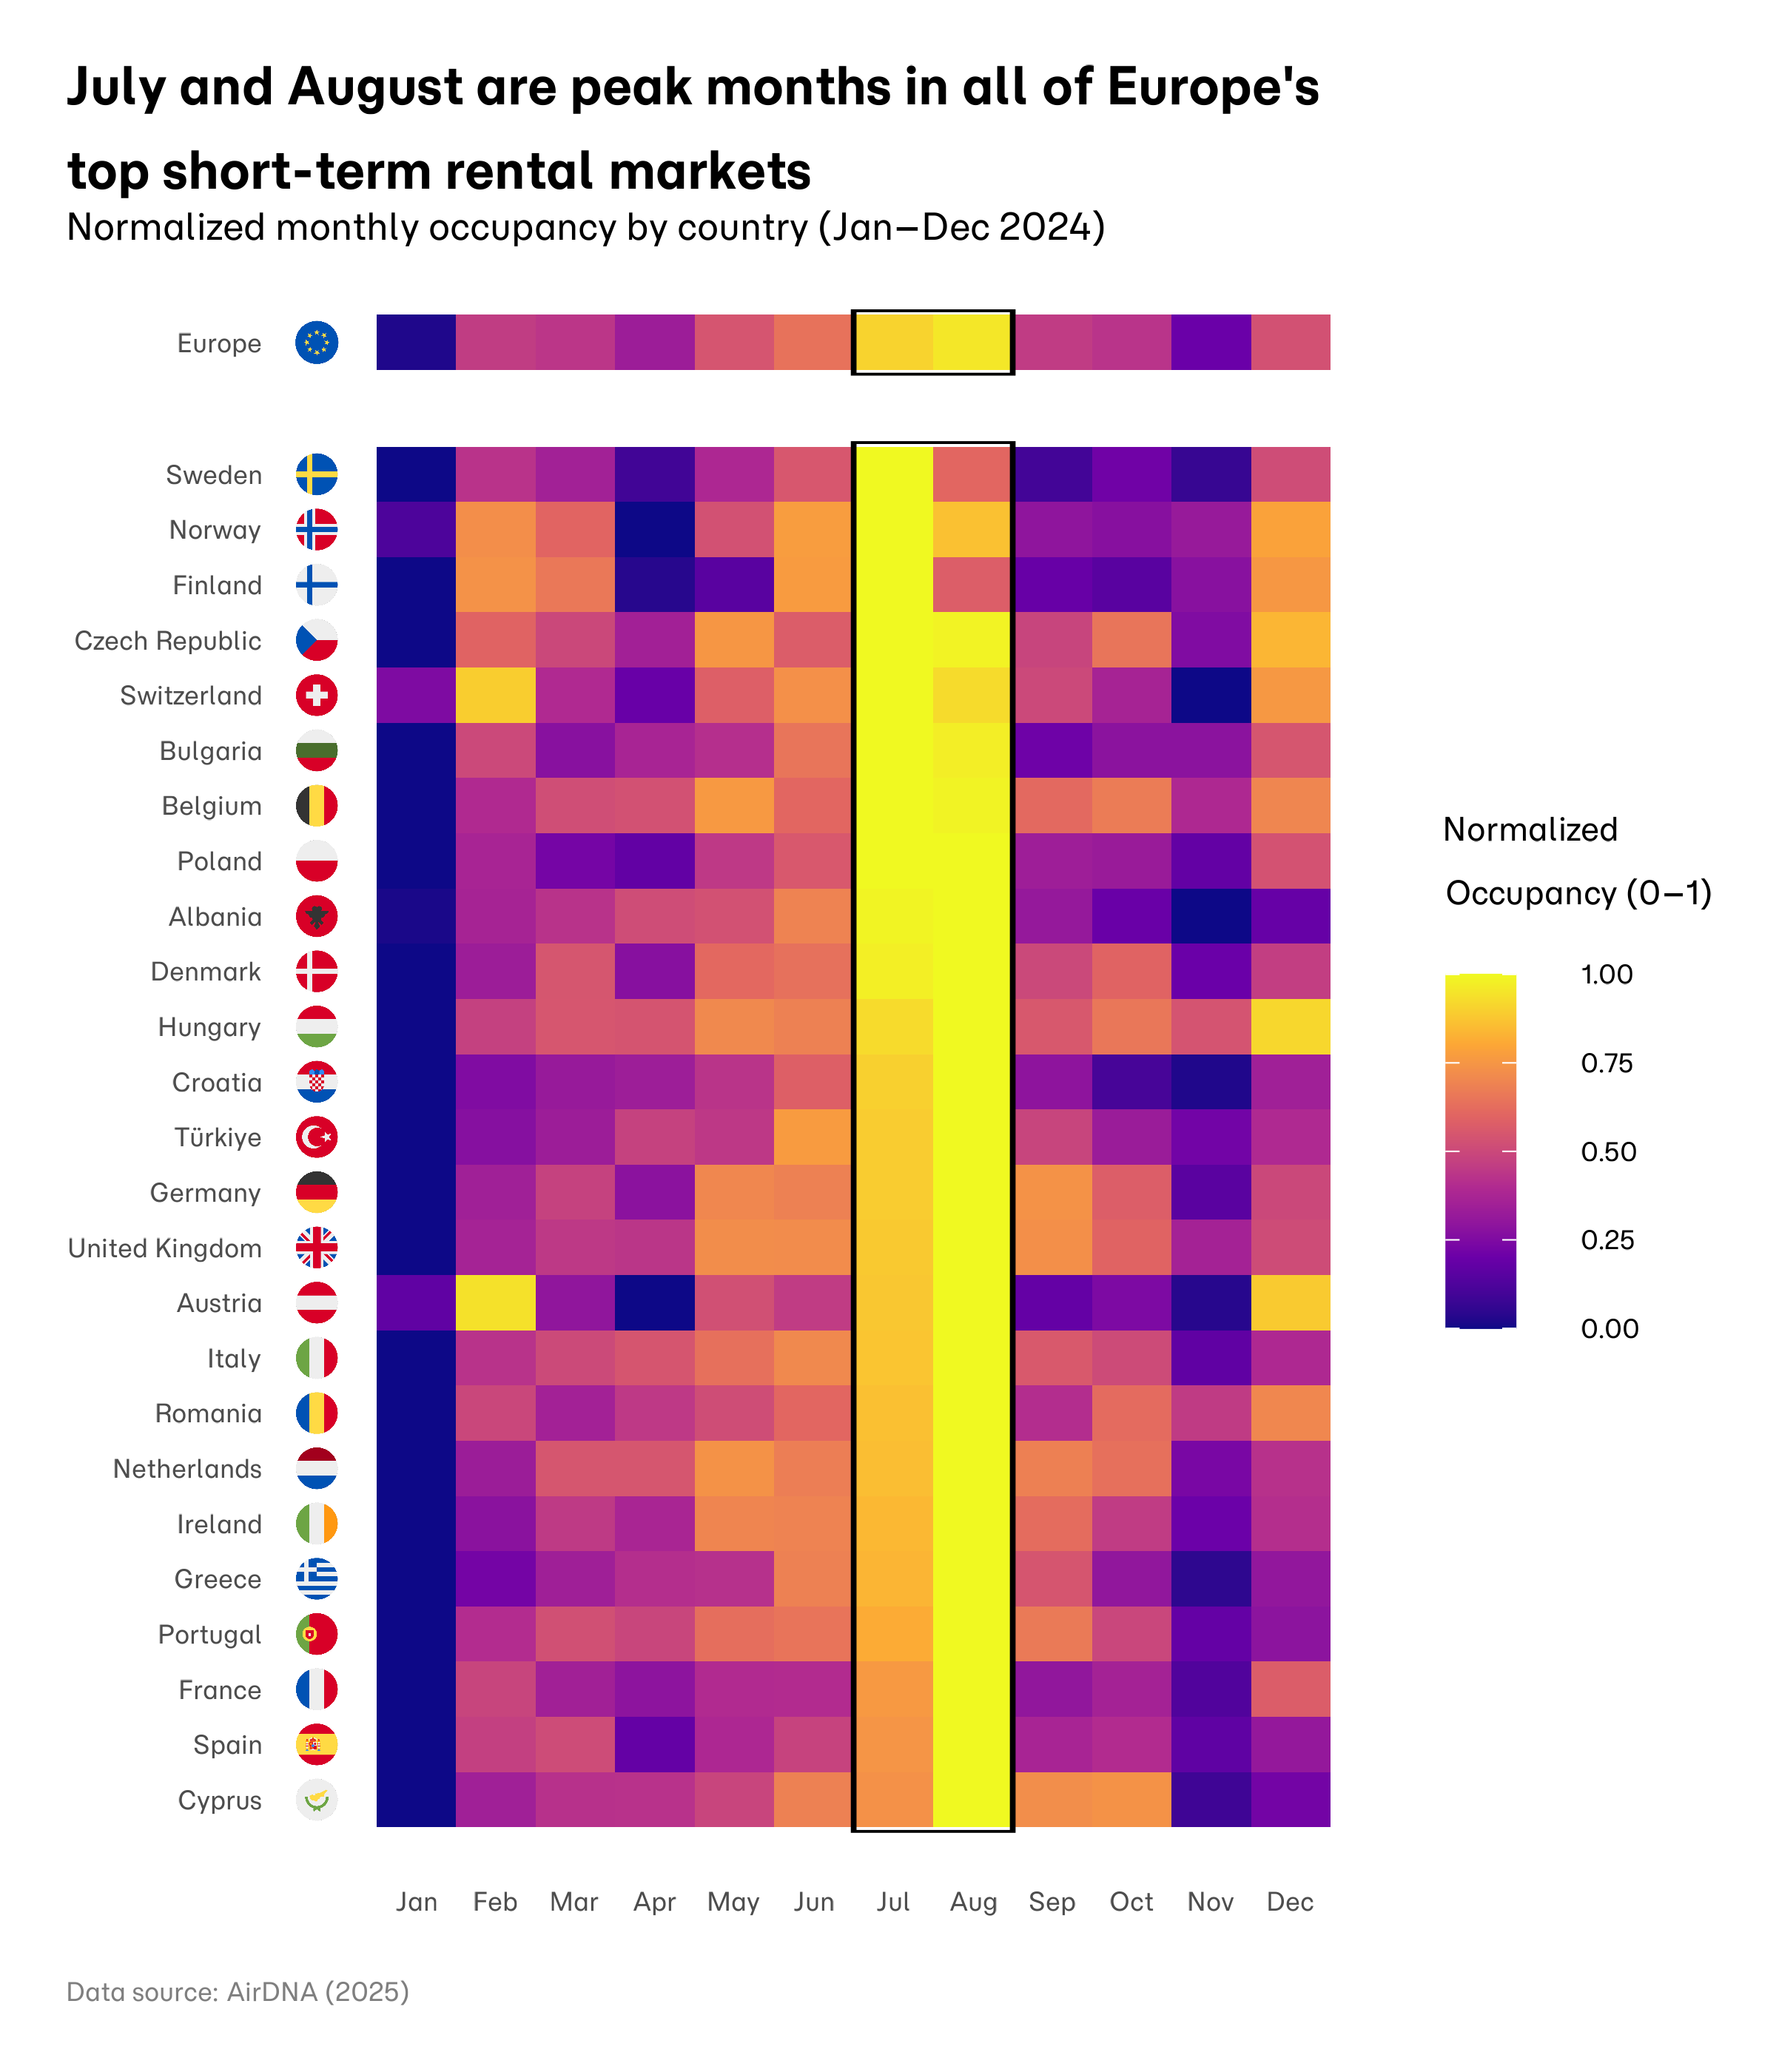
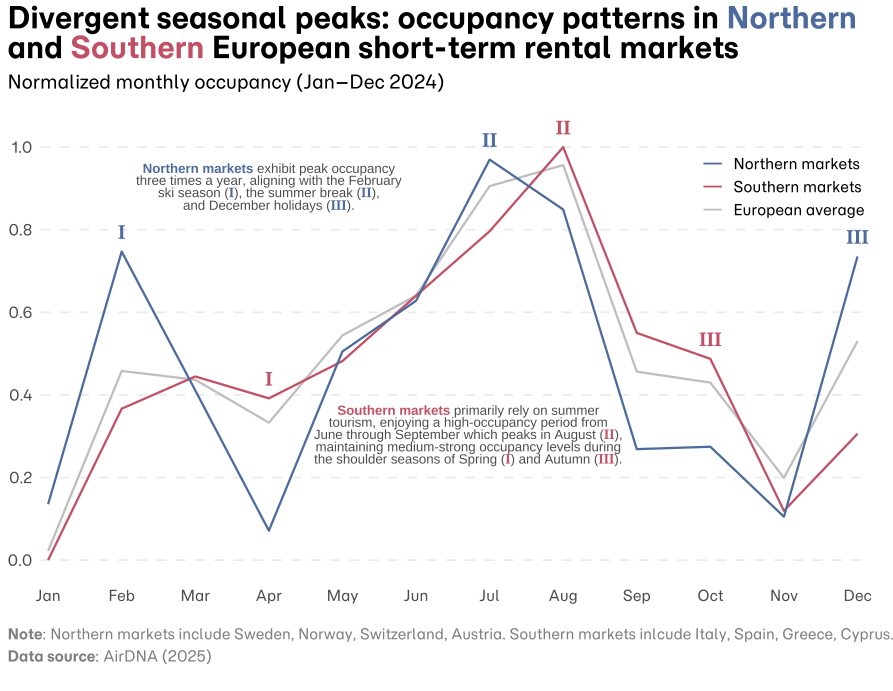
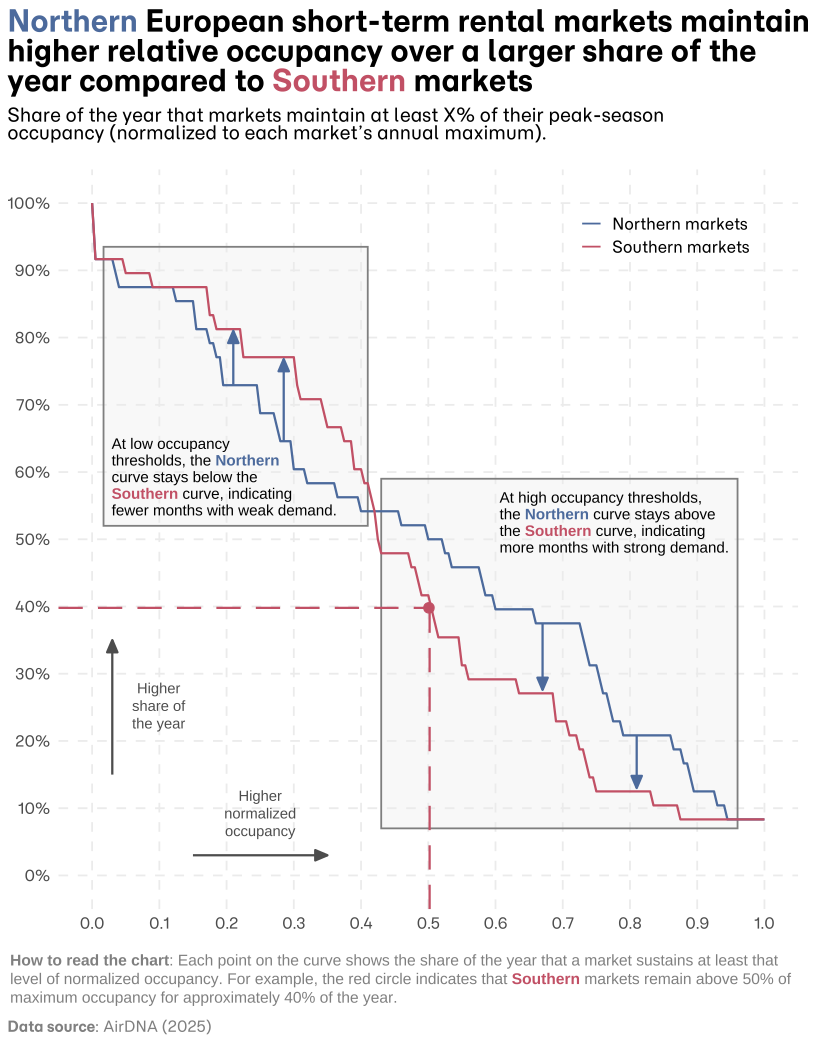
Europe's short-term rental markets show a shared summer peak despite differences in climate and location. The charts examine 2024 occupancy data for 25 large markets, comparing monthly patterns and the length of each market's busy season.
Reading the seasonal pattern
School holidays, workplace leave, transport schedules, climate, and seasonal accommodation supply may all shape when people travel. Eurostat's 2024 regional tourism statistics also show that July and August were the busiest months for overnight stays in most EU regions. That broader measure is consistent with a summer peak, but it does not establish which of these factors caused the AirDNA occupancy pattern or how much each contributed.
Sources and methodology
The occupancy data are attributed to AirDNA (2025) in the original charts. The Quarto analysis selects the 25 European markets with the most average active listings in 2024, normalizes each market's monthly occupancy to its own annual range, and calculates the share of the year above each normalized occupancy threshold. Its processing steps and definitions remain in the original analysis. Eurostat's overnight-stay measure is separate from AirDNA's occupancy series.