
NYC shootings surged in 2020–2021, then fell to a record low in 2025
Two views of reported NYC shooting incidents: monthly counts and within-year cumulative totals, 2006–2025, with 2026 through June 30.
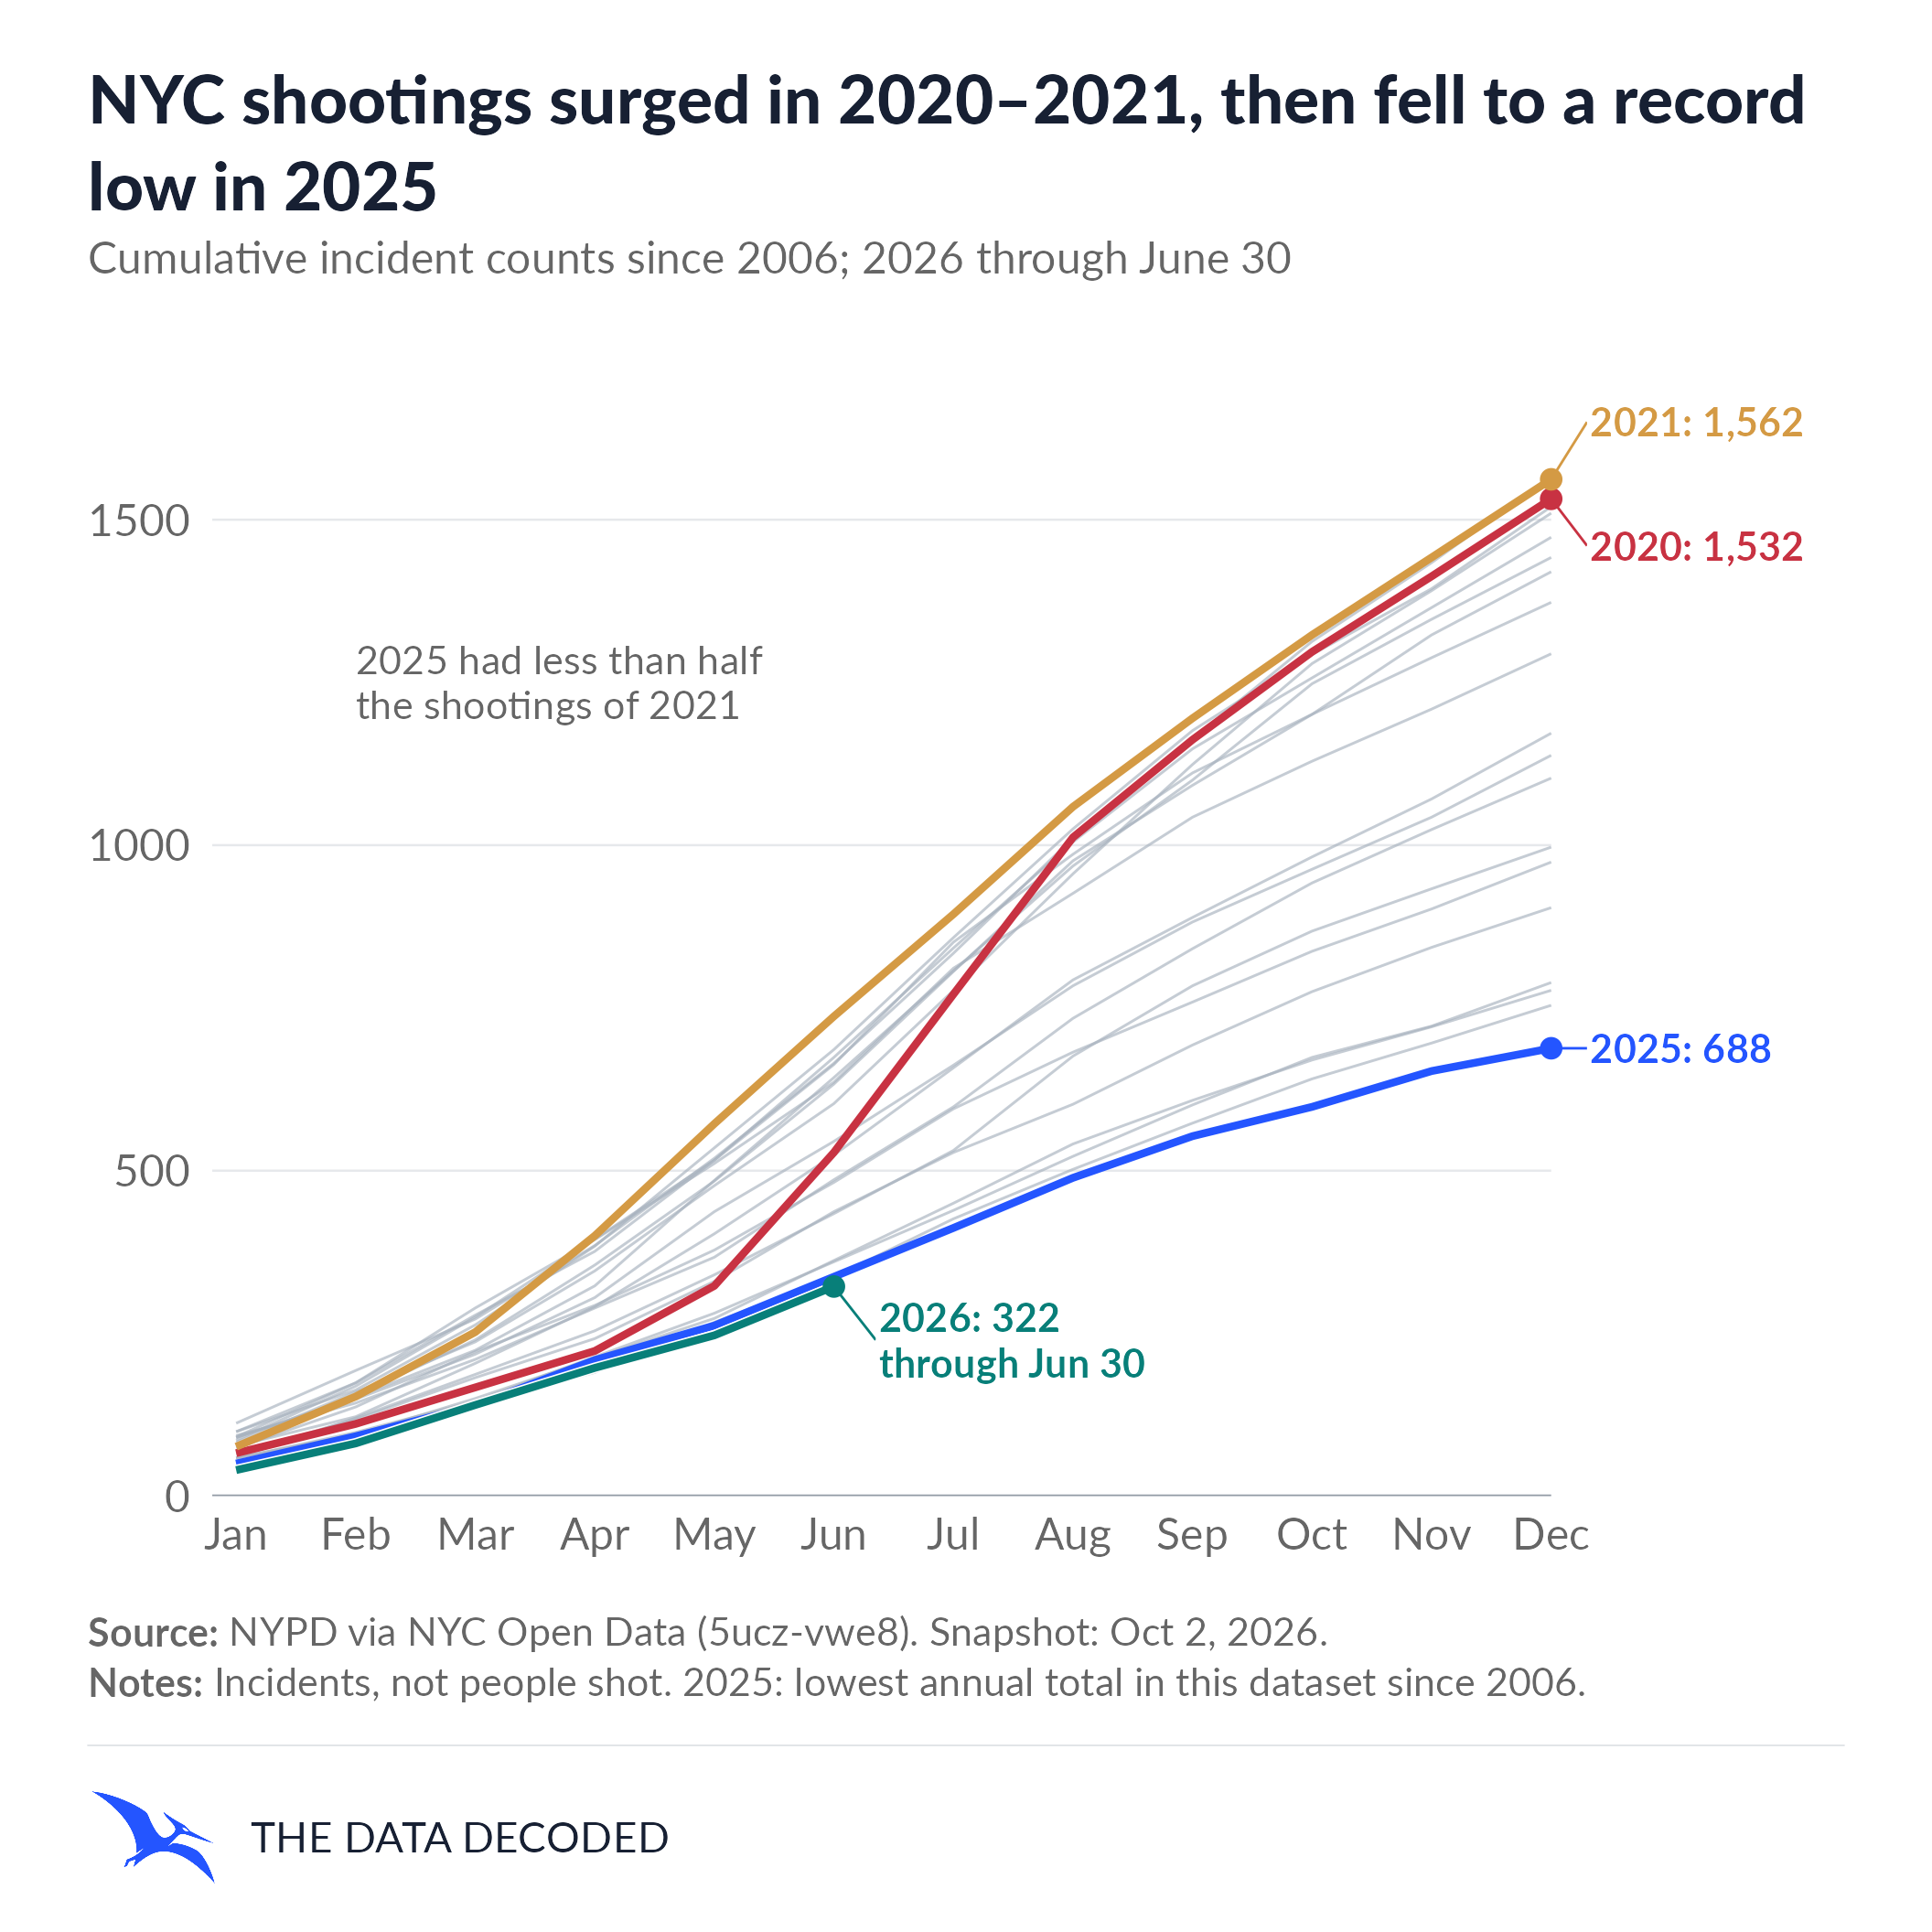
New York recorded a historic rise in shooting incidents during the pandemic and a substantial decline in the years that followed. The NYC Open Data series shows 1,532 incidents in 2020 and 1,562 in 2021. By 2025, the annual total had fallen to 688: 874 fewer incidents, or 56% below 2021. NYPD identifies 2025 as the lowest annual total in its longer record. In its year-end release, it says the total surpassed the previous record low of 754, set in 2018, by 66 incidents.
These charts count reported shooting incidents, not people shot, and they cannot describe every part of public safety. Assaults, theft, and other offenses need their own accounting. Citywide figures also do not show how safety is experienced in each neighborhood; communities where shootings remain concentrated have more at stake than a reassuring citywide average.
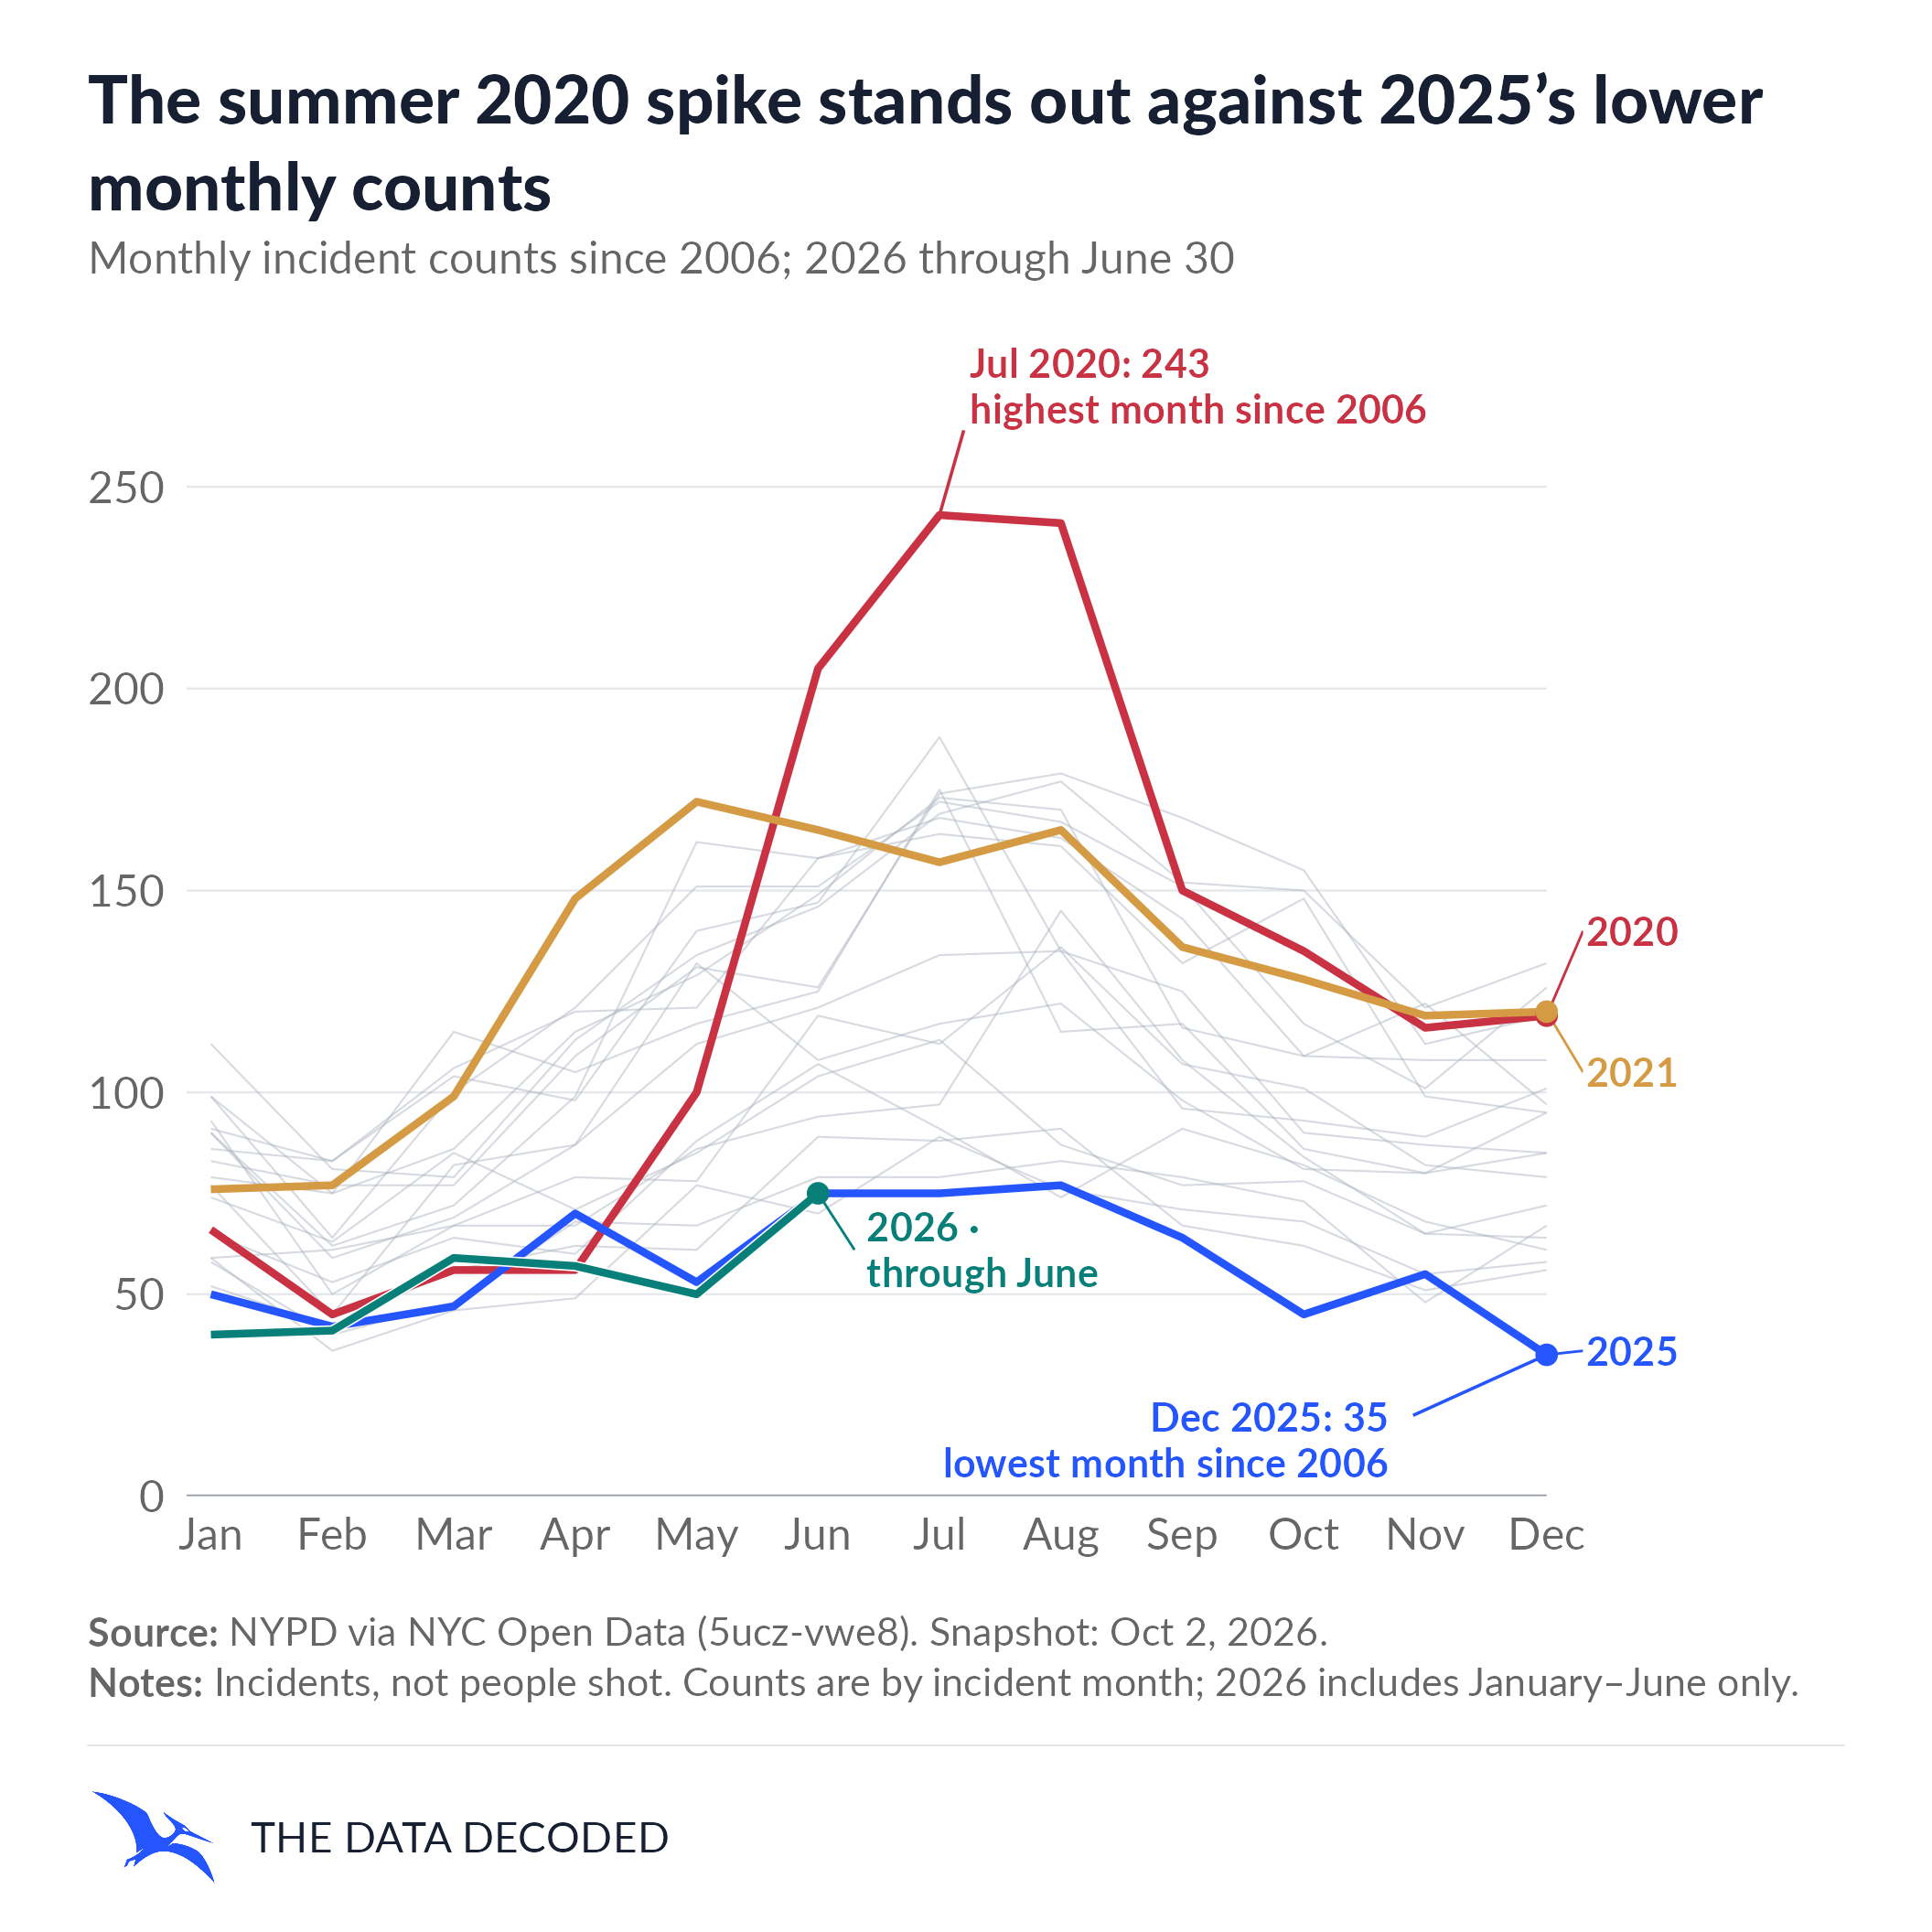
The monthly chart shows the timing of the change. July 2020 had 243 incidents, the highest monthly count in this dataset since 2006. December 2025 had 35, the lowest in the series. Those months fall at different points in the seasonal cycle, so comparing July directly with December exaggerates the underlying change: summer months generally have more shootings than winter months. The complete-year totals provide the clearer annual comparison. By 2025, the count had fallen below the previous annual low set in 2018.
The improvement continued into the first half of 2026. From January through June, the city recorded 322 incidents, compared with 337 in the same period of 2025, a decline of 15 incidents (4.5%). The 2026 line ends on June 30; it is a partial year and is not projected to a full-year total.
Explaining this reversal is harder than documenting it. During the pandemic, schools and services were disrupted, economic insecurity intensified, and relations between police and communities were strained. Firearm homicide also increased across the United States through 2021, before declining through 2023. That national measure is not the same as NYC shooting incidents, but the wider pattern makes a single local explanation difficult to sustain.
As daily life resumed, shootings declined. NYPD credits its focus on shooting hotspots, violent groups, and illegal guns. Community violence prevention and restored social supports are also plausible contributors. These approaches can coexist, but the charts cannot identify how much each contributed to New York’s decline. Research on focused enforcement and community prevention offers evidence about particular interventions in particular places; it does not establish the causes of this citywide trend.
The recovery went beyond a return to the pre-pandemic level. New York has shown that much lower shooting totals are possible, while the uneven distribution of violence means many residents still have reason to ask whether progress will last and reach their neighborhoods. The decline does not settle the policing debate. Evidence that focused enforcement can reduce gun violence is a reason to be cautious about sweeping cuts across the board, while still assessing which approaches work, where, and for whom.
A better question is what parts of the improvement New York can sustain, and how it can extend them to neighborhoods still waiting to feel safer. The charts establish the timing and scale of the change; they do not establish its causes. Counts of shooting incidents describe a grave human toll, but they are not a complete measure of crime or safety.
Sources and methodology
Sources
- New York City Police Department, Shootings (2006–Present) dataset, ID
5ucz-vwe8. - NYPD, 2025 year-end announcement.
- NYPD, first-half 2026 announcement.
- National Center for Health Statistics, Trends in Death Rates for Leading Methods of Injury: United States, 2003–2023.
- CDC, Community Violence Prevention: A Public Health Approach.
- U.S. Department of Justice, Office of Justice Programs, research on focused deterrence and gun-violence prevention.
What the counts measure
The NYC Open Data dataset describes shooting incidents. Each incident is counted once using its INCIDENT_KEY; the related number of shooting victims is a different measure. These figures do not represent all gun violence, all crime, or the number of people shot in each incident.
Coverage and calculations
The dataset’s stated coverage begins in 2006. The figures here count distinct incident keys by the date the incident occurred. Monthly counts are grouped by occurrence month; cumulative counts restart at January each year. Annual totals are compared only for complete calendar years, 2006–2025. Each of those years has records in all twelve months. The January–June comparison uses the same six months in 2025 and 2026.
The NYC Open Data records analyzed were retrieved October 2, 2026 and cover January 1, 2006 through June 30, 2026. They contain 24,310 distinct incident IDs, with no duplicate IDs or missing incident keys or occurrence dates. The NYPD’s July 2, 2026 first-half release independently reports 322 incidents through June 30, matching the dataset and supporting that cutoff. NYPD notes its statistics are preliminary and may be revised. The remaining months of 2026 are not included or estimated.
For complete years, 2021 had 1,562 incidents and 2025 had 688: a reduction of 874 (56.0%). NYPD’s January 6, 2026 release likewise states 688 in its announcement prose and says this beat the previous low of 754 in 2018 by 66. Its detailed year-end table lists 687 for 2025, one fewer than the prose. The release does not explain this difference; the charts use the reproducible NYC Open Data incident count of 688. In the monthly series, July 2020 had 243 incidents, the highest month in the dataset since 2006, and December 2025 had 35, the lowest month in the series.