
How have tourist arrivals in Israel changed since the outbreak of the Gaza War?
Tourist arrivals by world region (2022-2025)
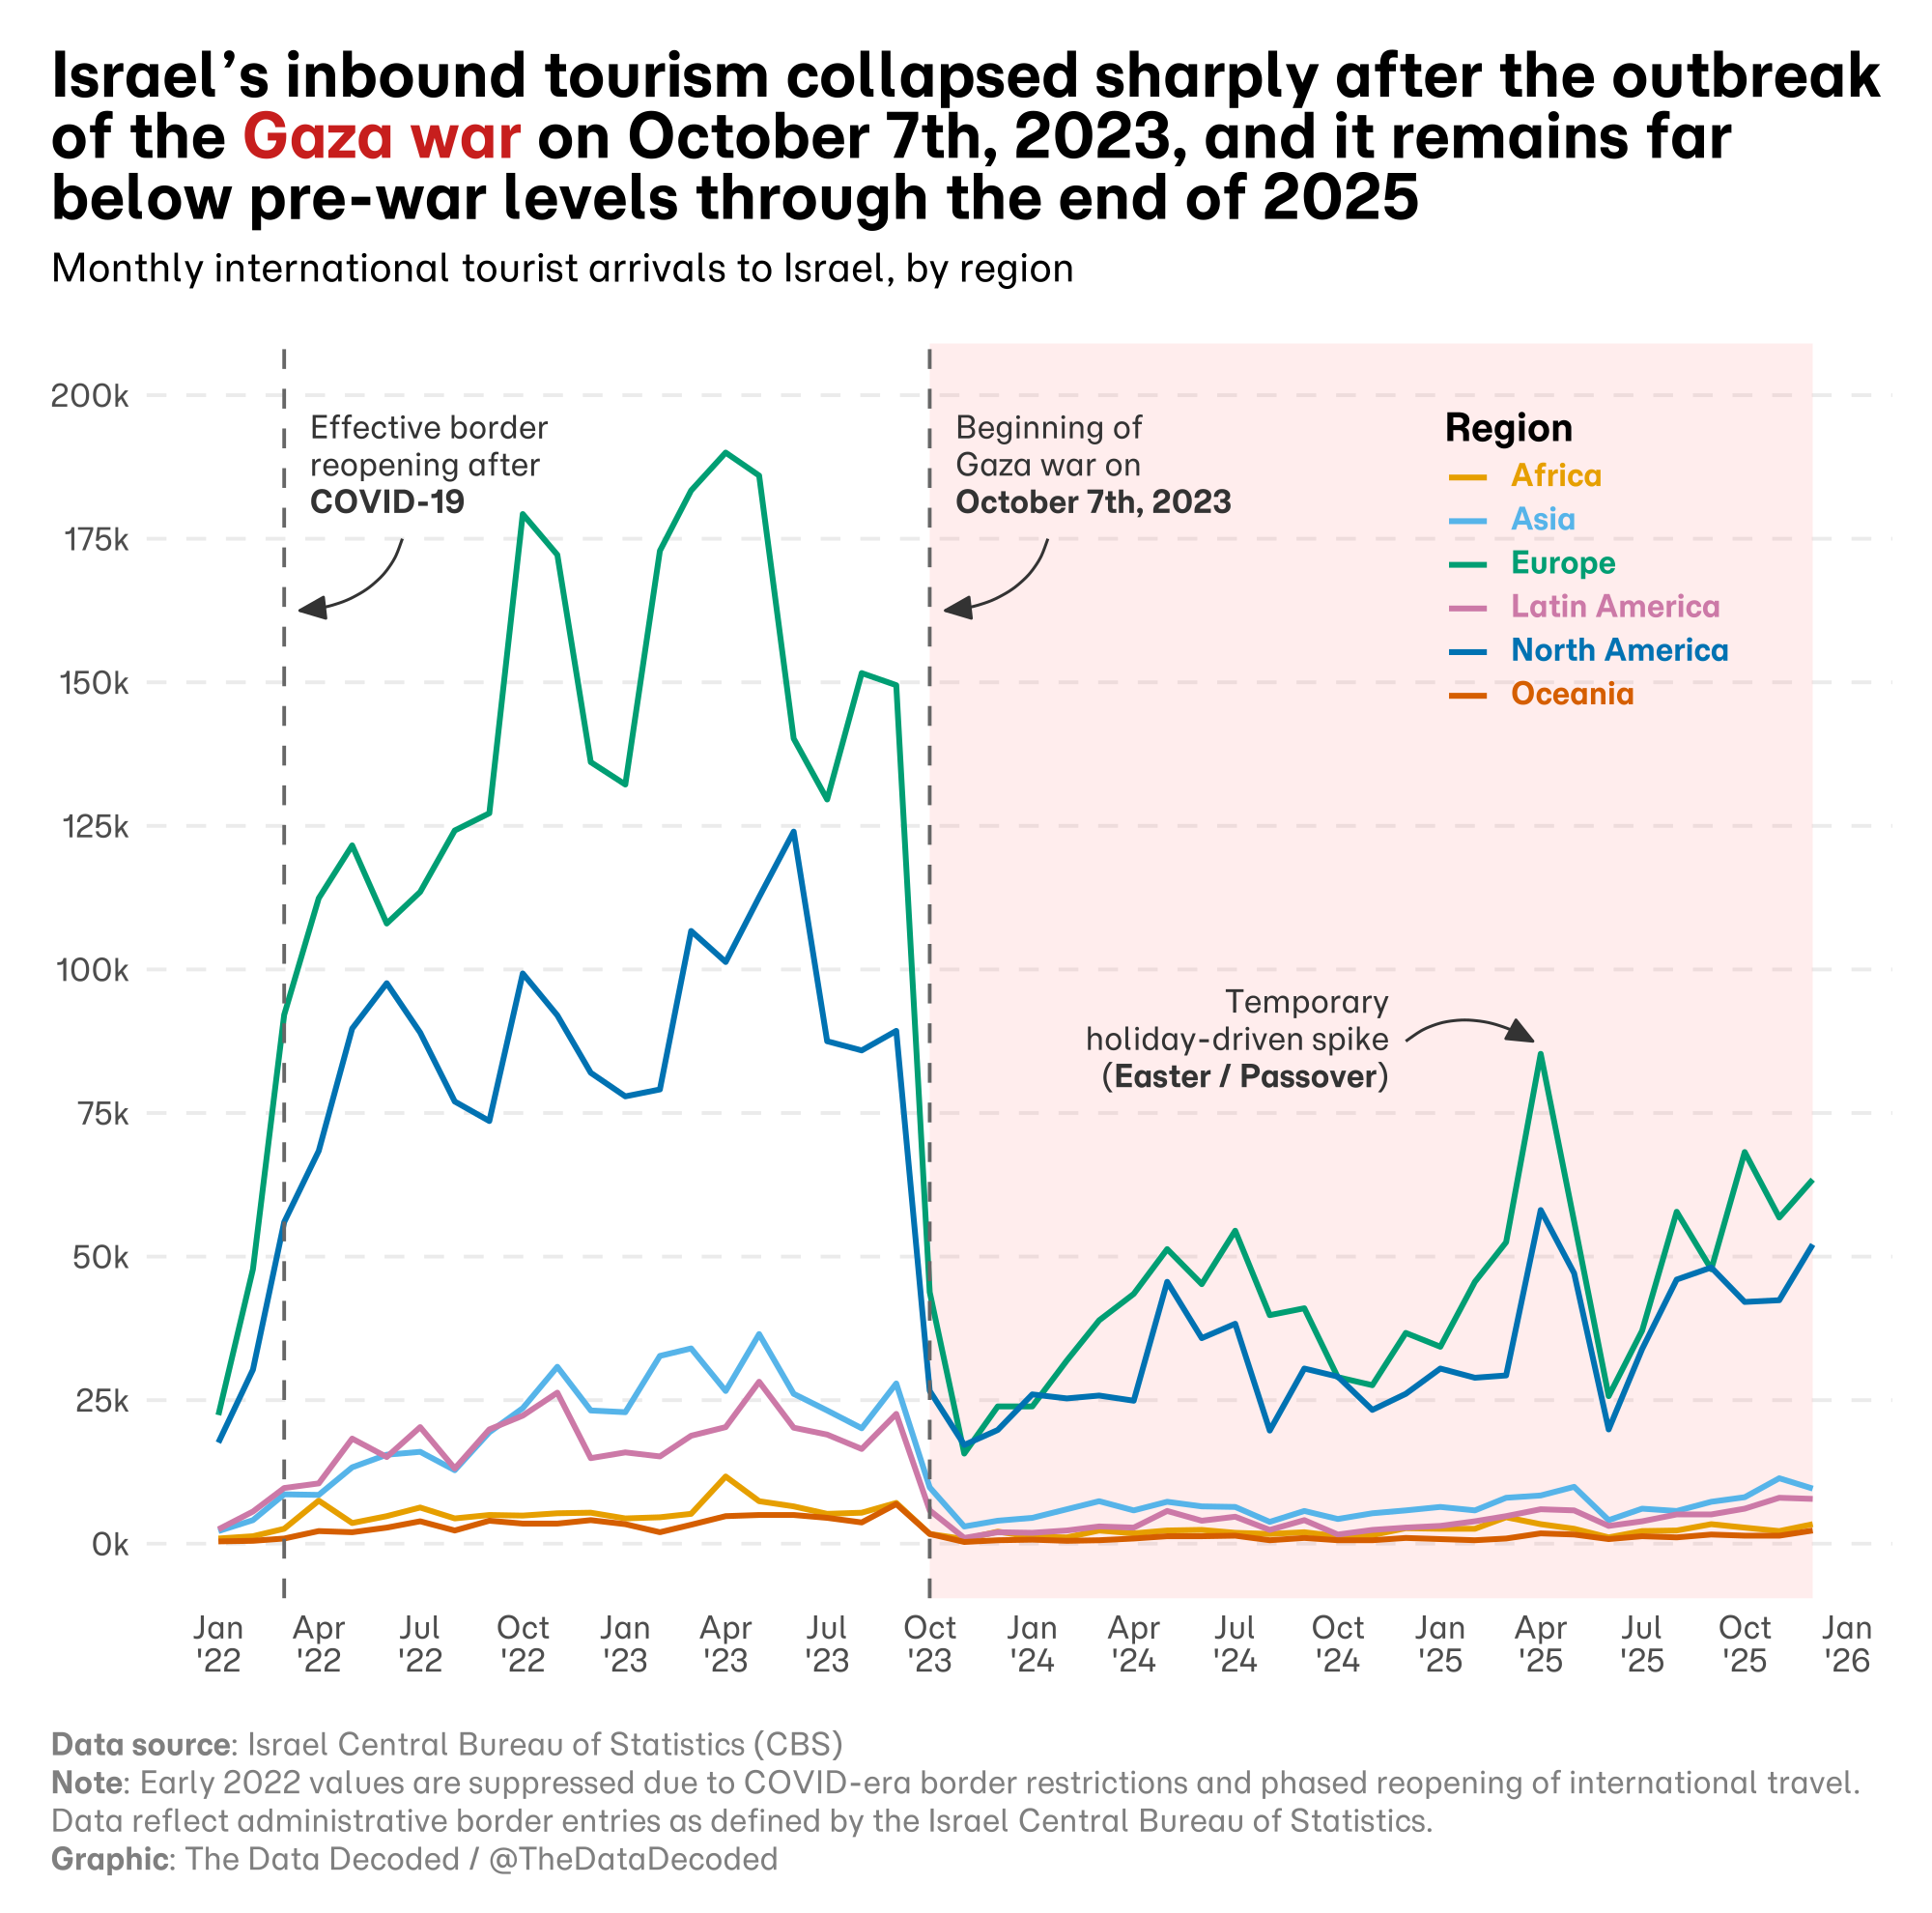
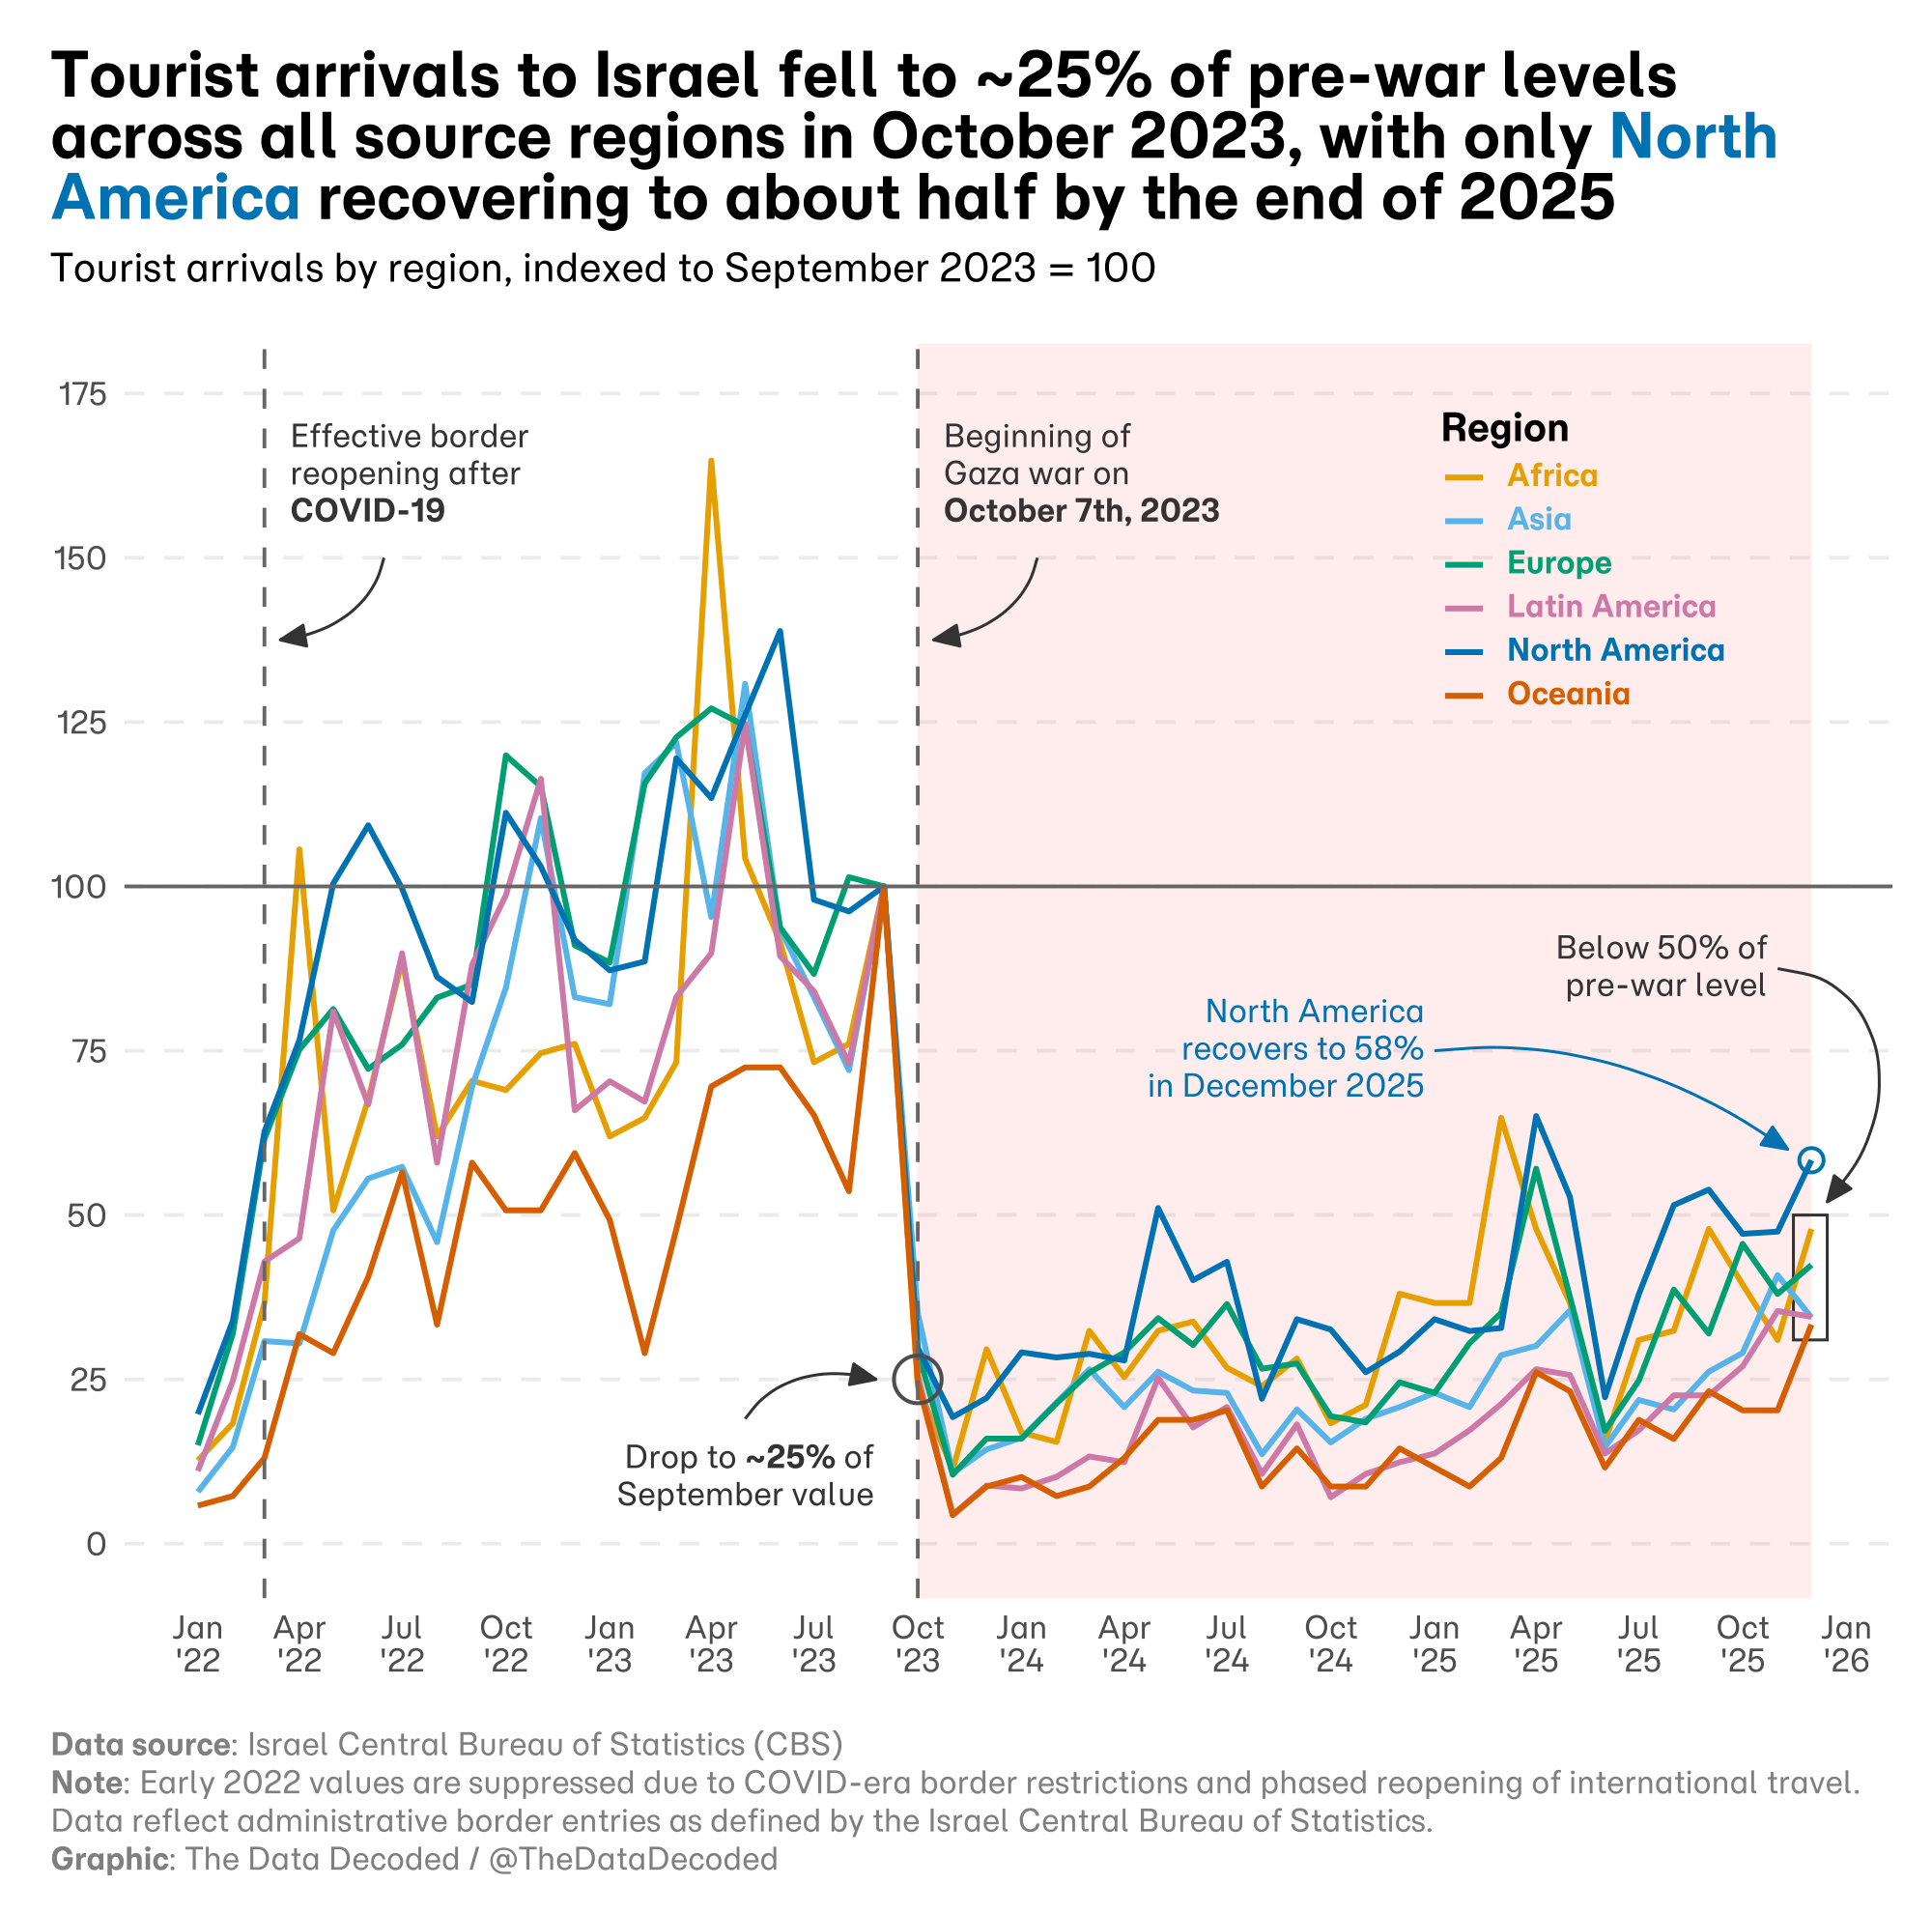
The first chart shows monthly arrivals to Israel by world region. The second compares each region with its September 2023 level, set to 100, to make the relative changes easier to see.
Sources and methodology
The data come from the Israel Central Bureau of Statistics. The original chart notes that early 2022 values are suppressed because of COVID-era border restrictions and phased reopening. Arrivals are administrative border entries as defined by the bureau. The original Quarto analysis prepares the monthly regional series and the September 2023 index.