
Global aviation sector CO₂ emissions
Evolution and seasonality in the period 2019–2025, and contribution by international vs. domestic aviation
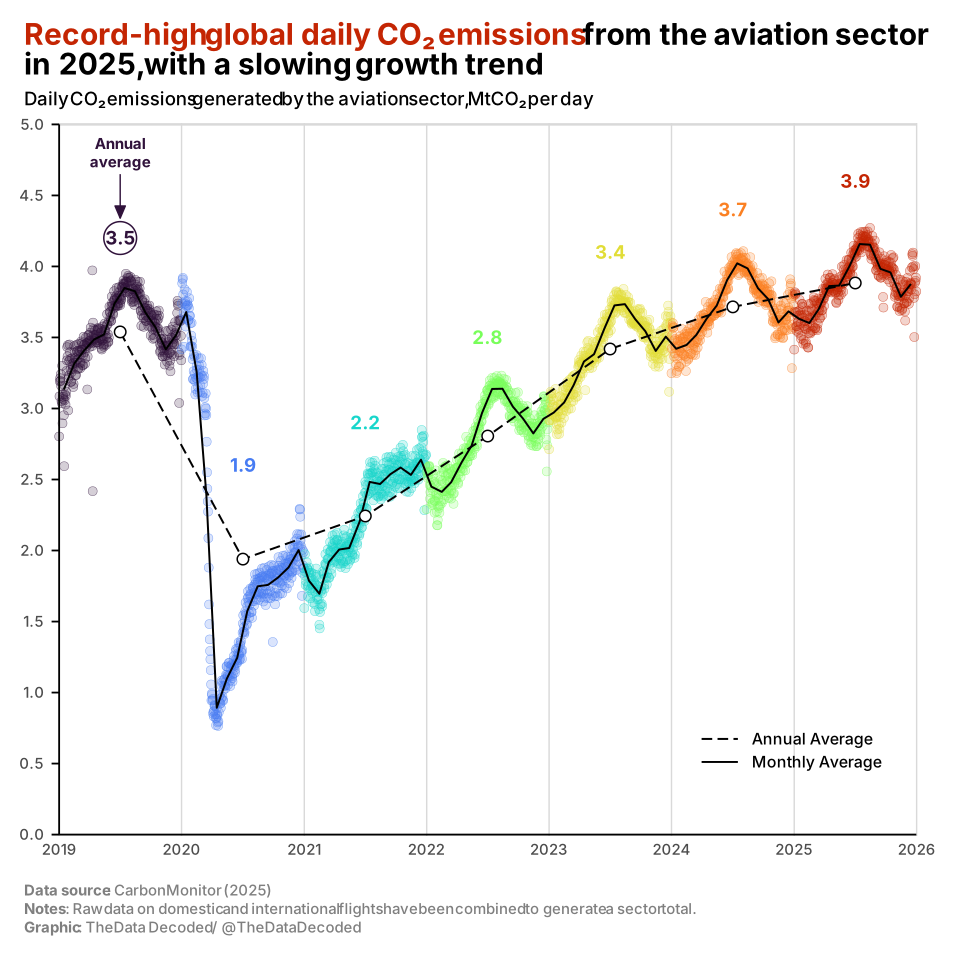
Global aviation CO₂ emissions fell sharply in 2020. The daily average was about 1.9 million tonnes, compared with 3.5 million tonnes in 2019. It rose in each subsequent year, reaching about 3.9 million tonnes per day in 2025.
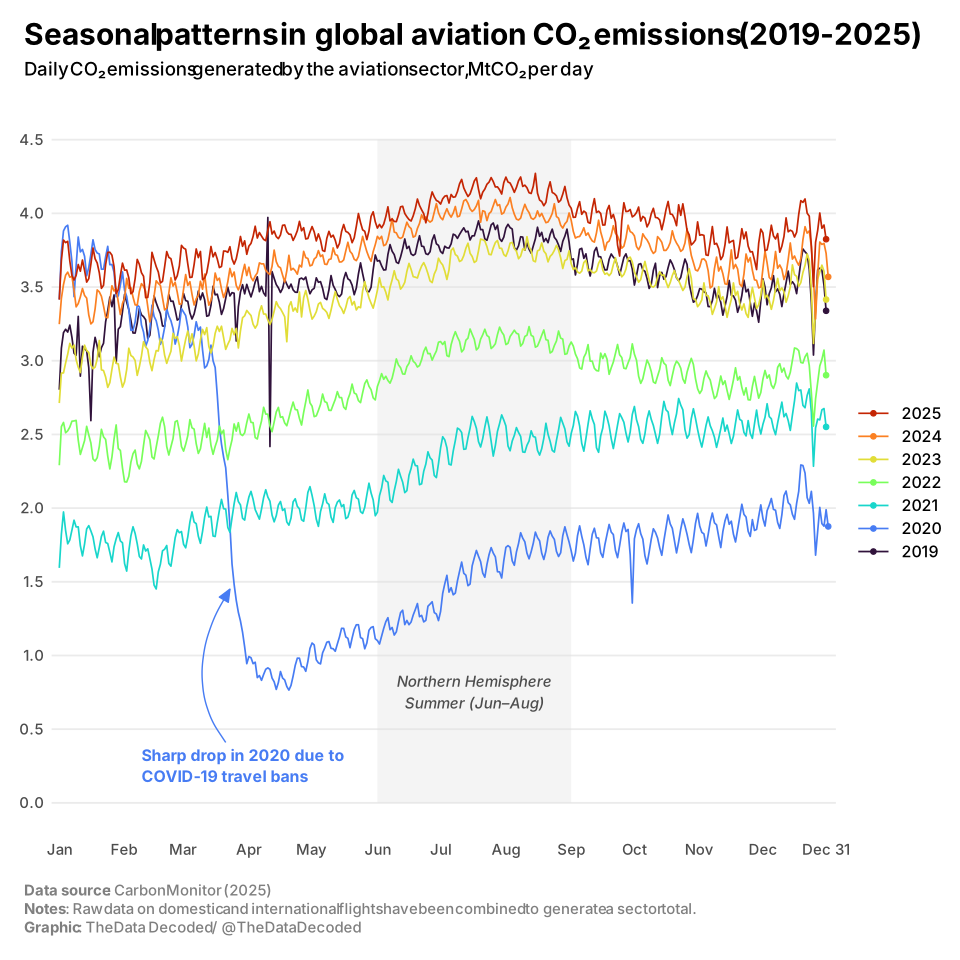
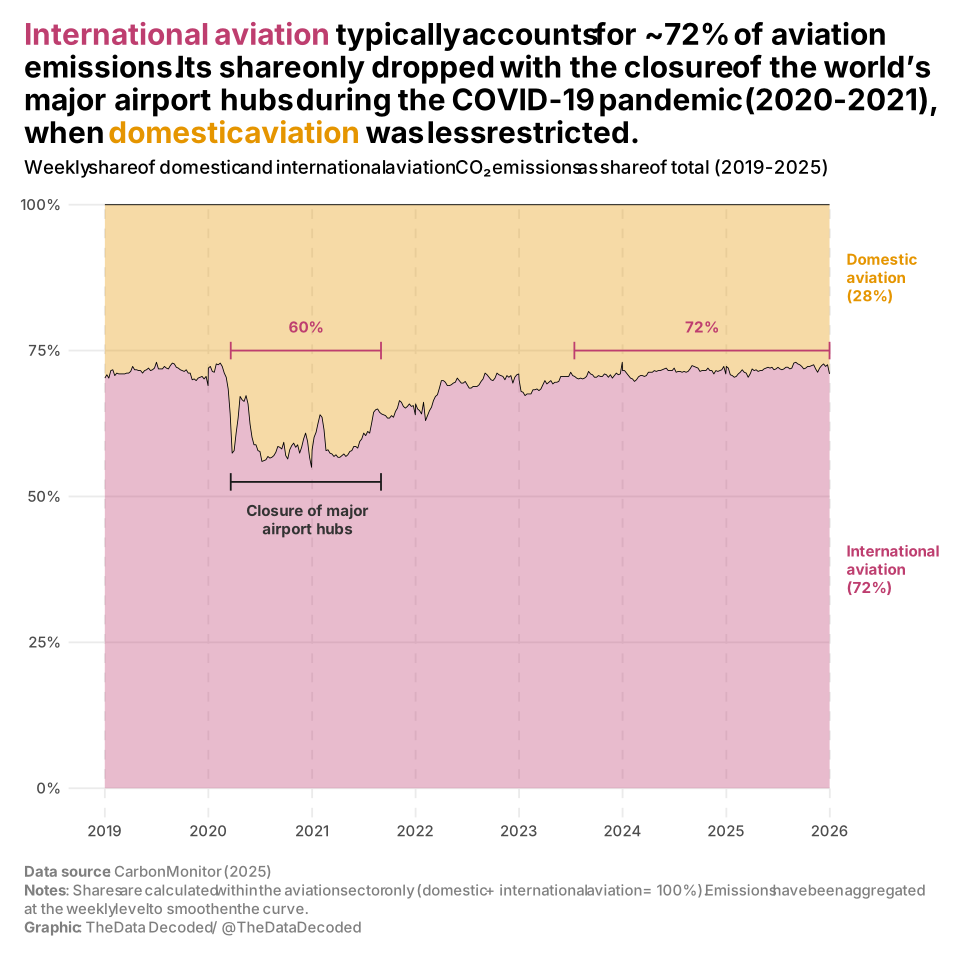
The first chart follows the daily total and shows monthly and annual averages. The second aligns the years by day of year so their seasonal patterns can be compared. The third tracks how the shares from domestic and international aviation changed over time.
Sources and methodology
The source is Carbon Monitor. The original Quarto analysis sums country records for domestic and international aviation into daily global totals. The annual figures above are the mean of those daily totals, rounded to one decimal place.
For the share chart, domestic and international emissions are each divided by their combined daily total. The analysis rounds those daily shares to two decimal places before averaging them by week. The charts cover 2019–2025.