
Youth unemployment across the EU
Explore monthly youth unemployment in all 27 current EU countries since 2000, using the same scales and the published EU-27 comparison.
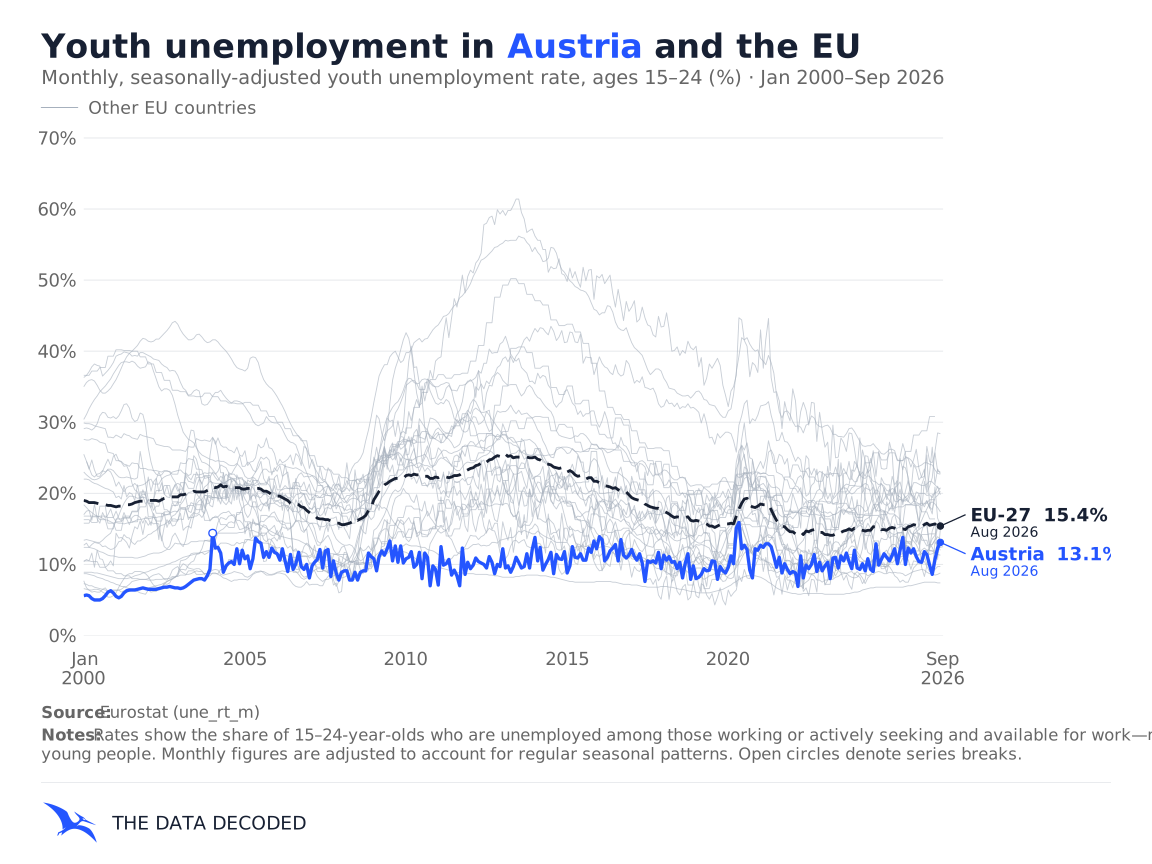
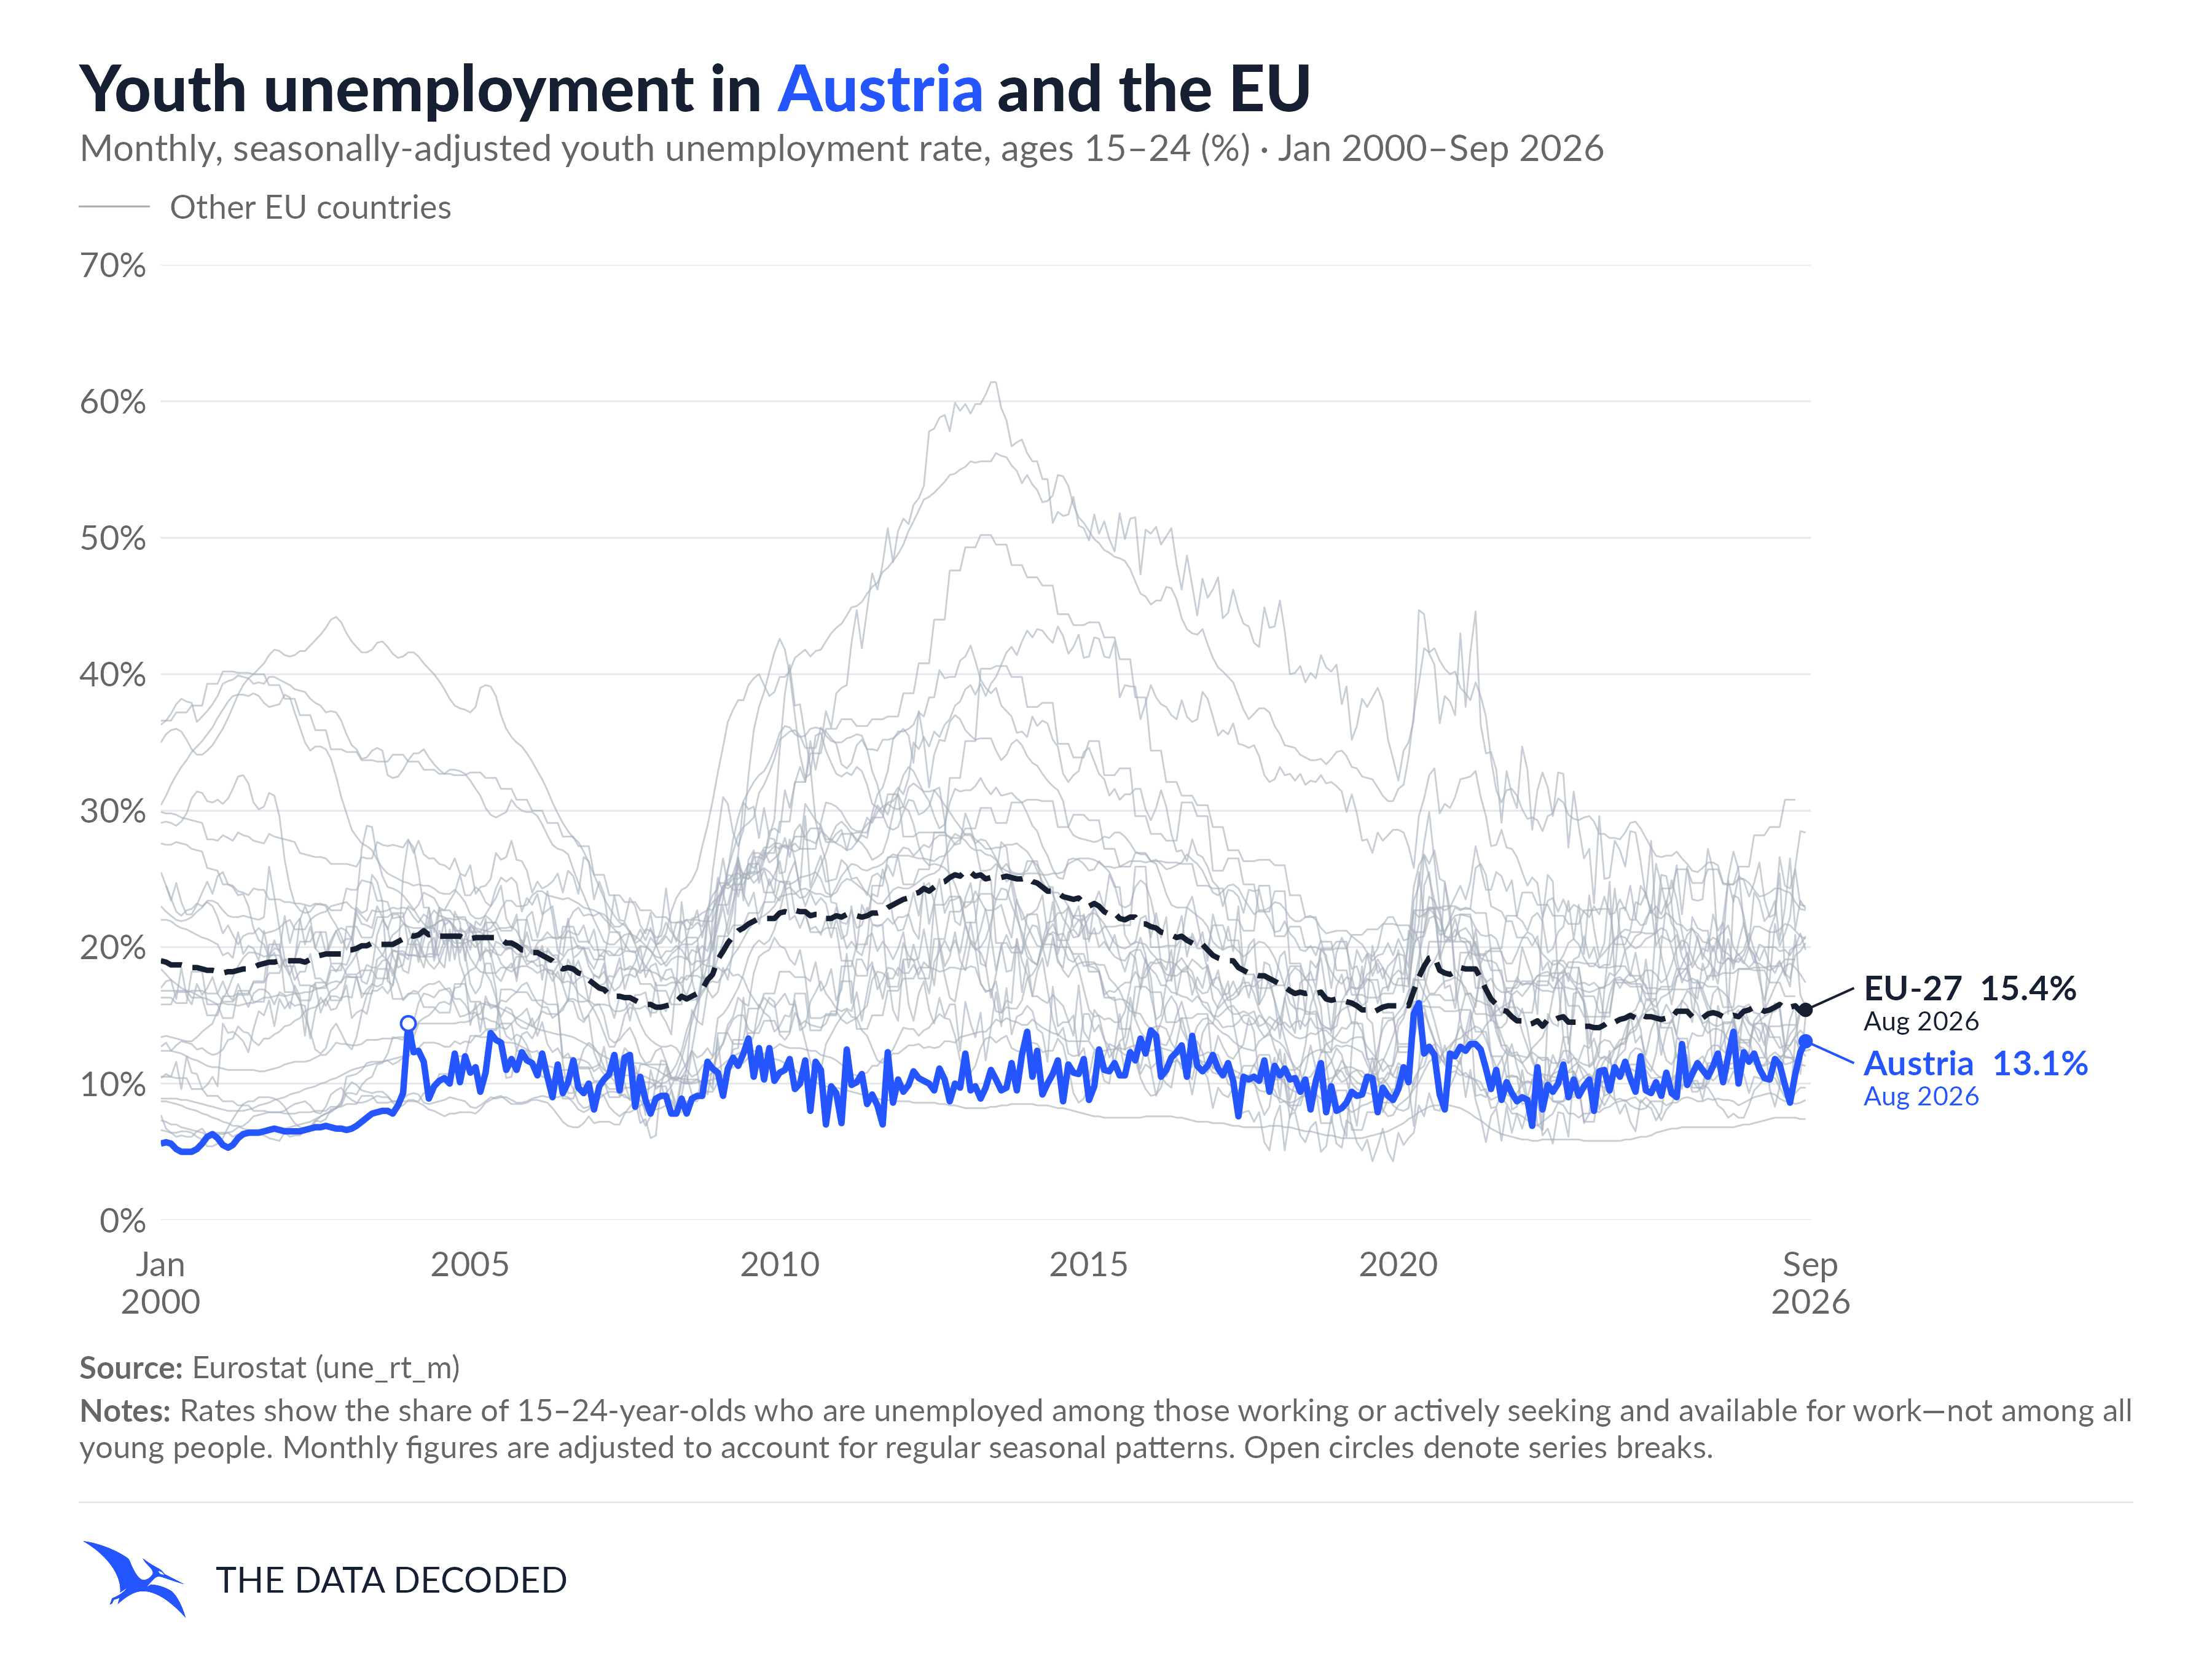
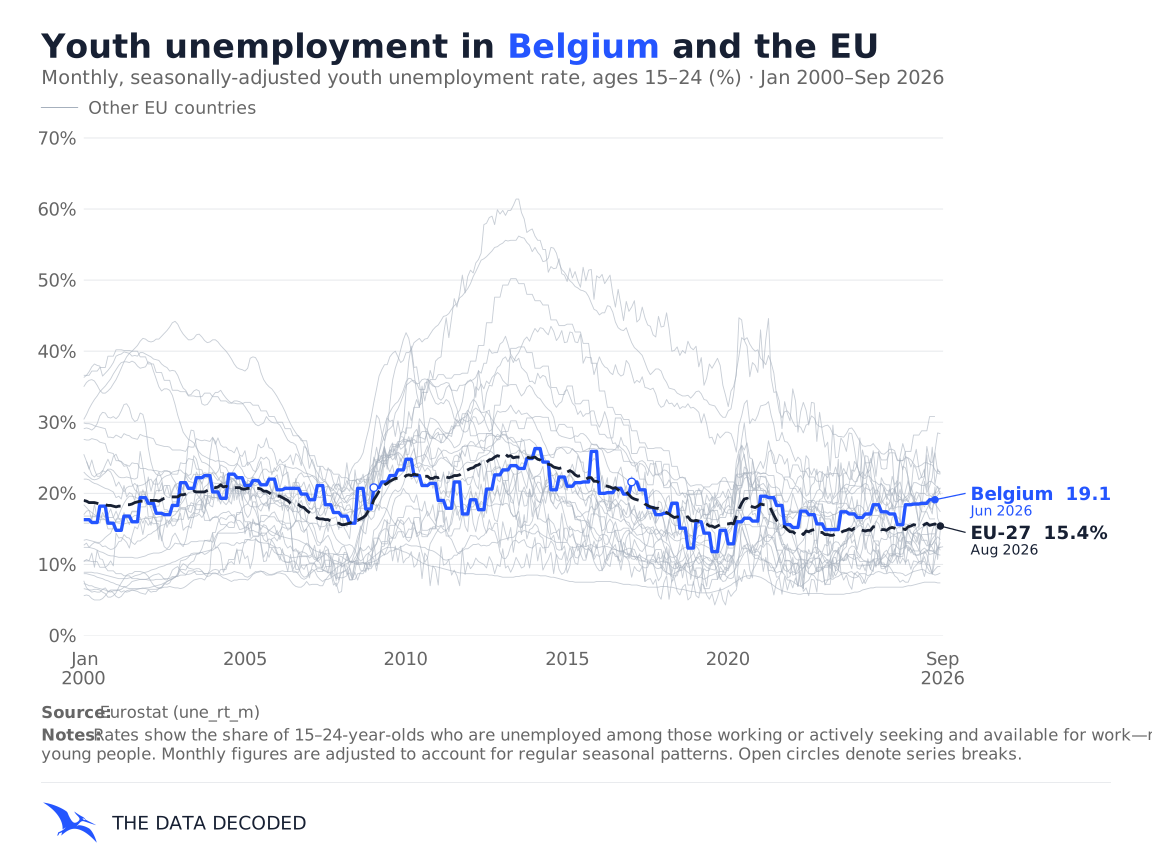
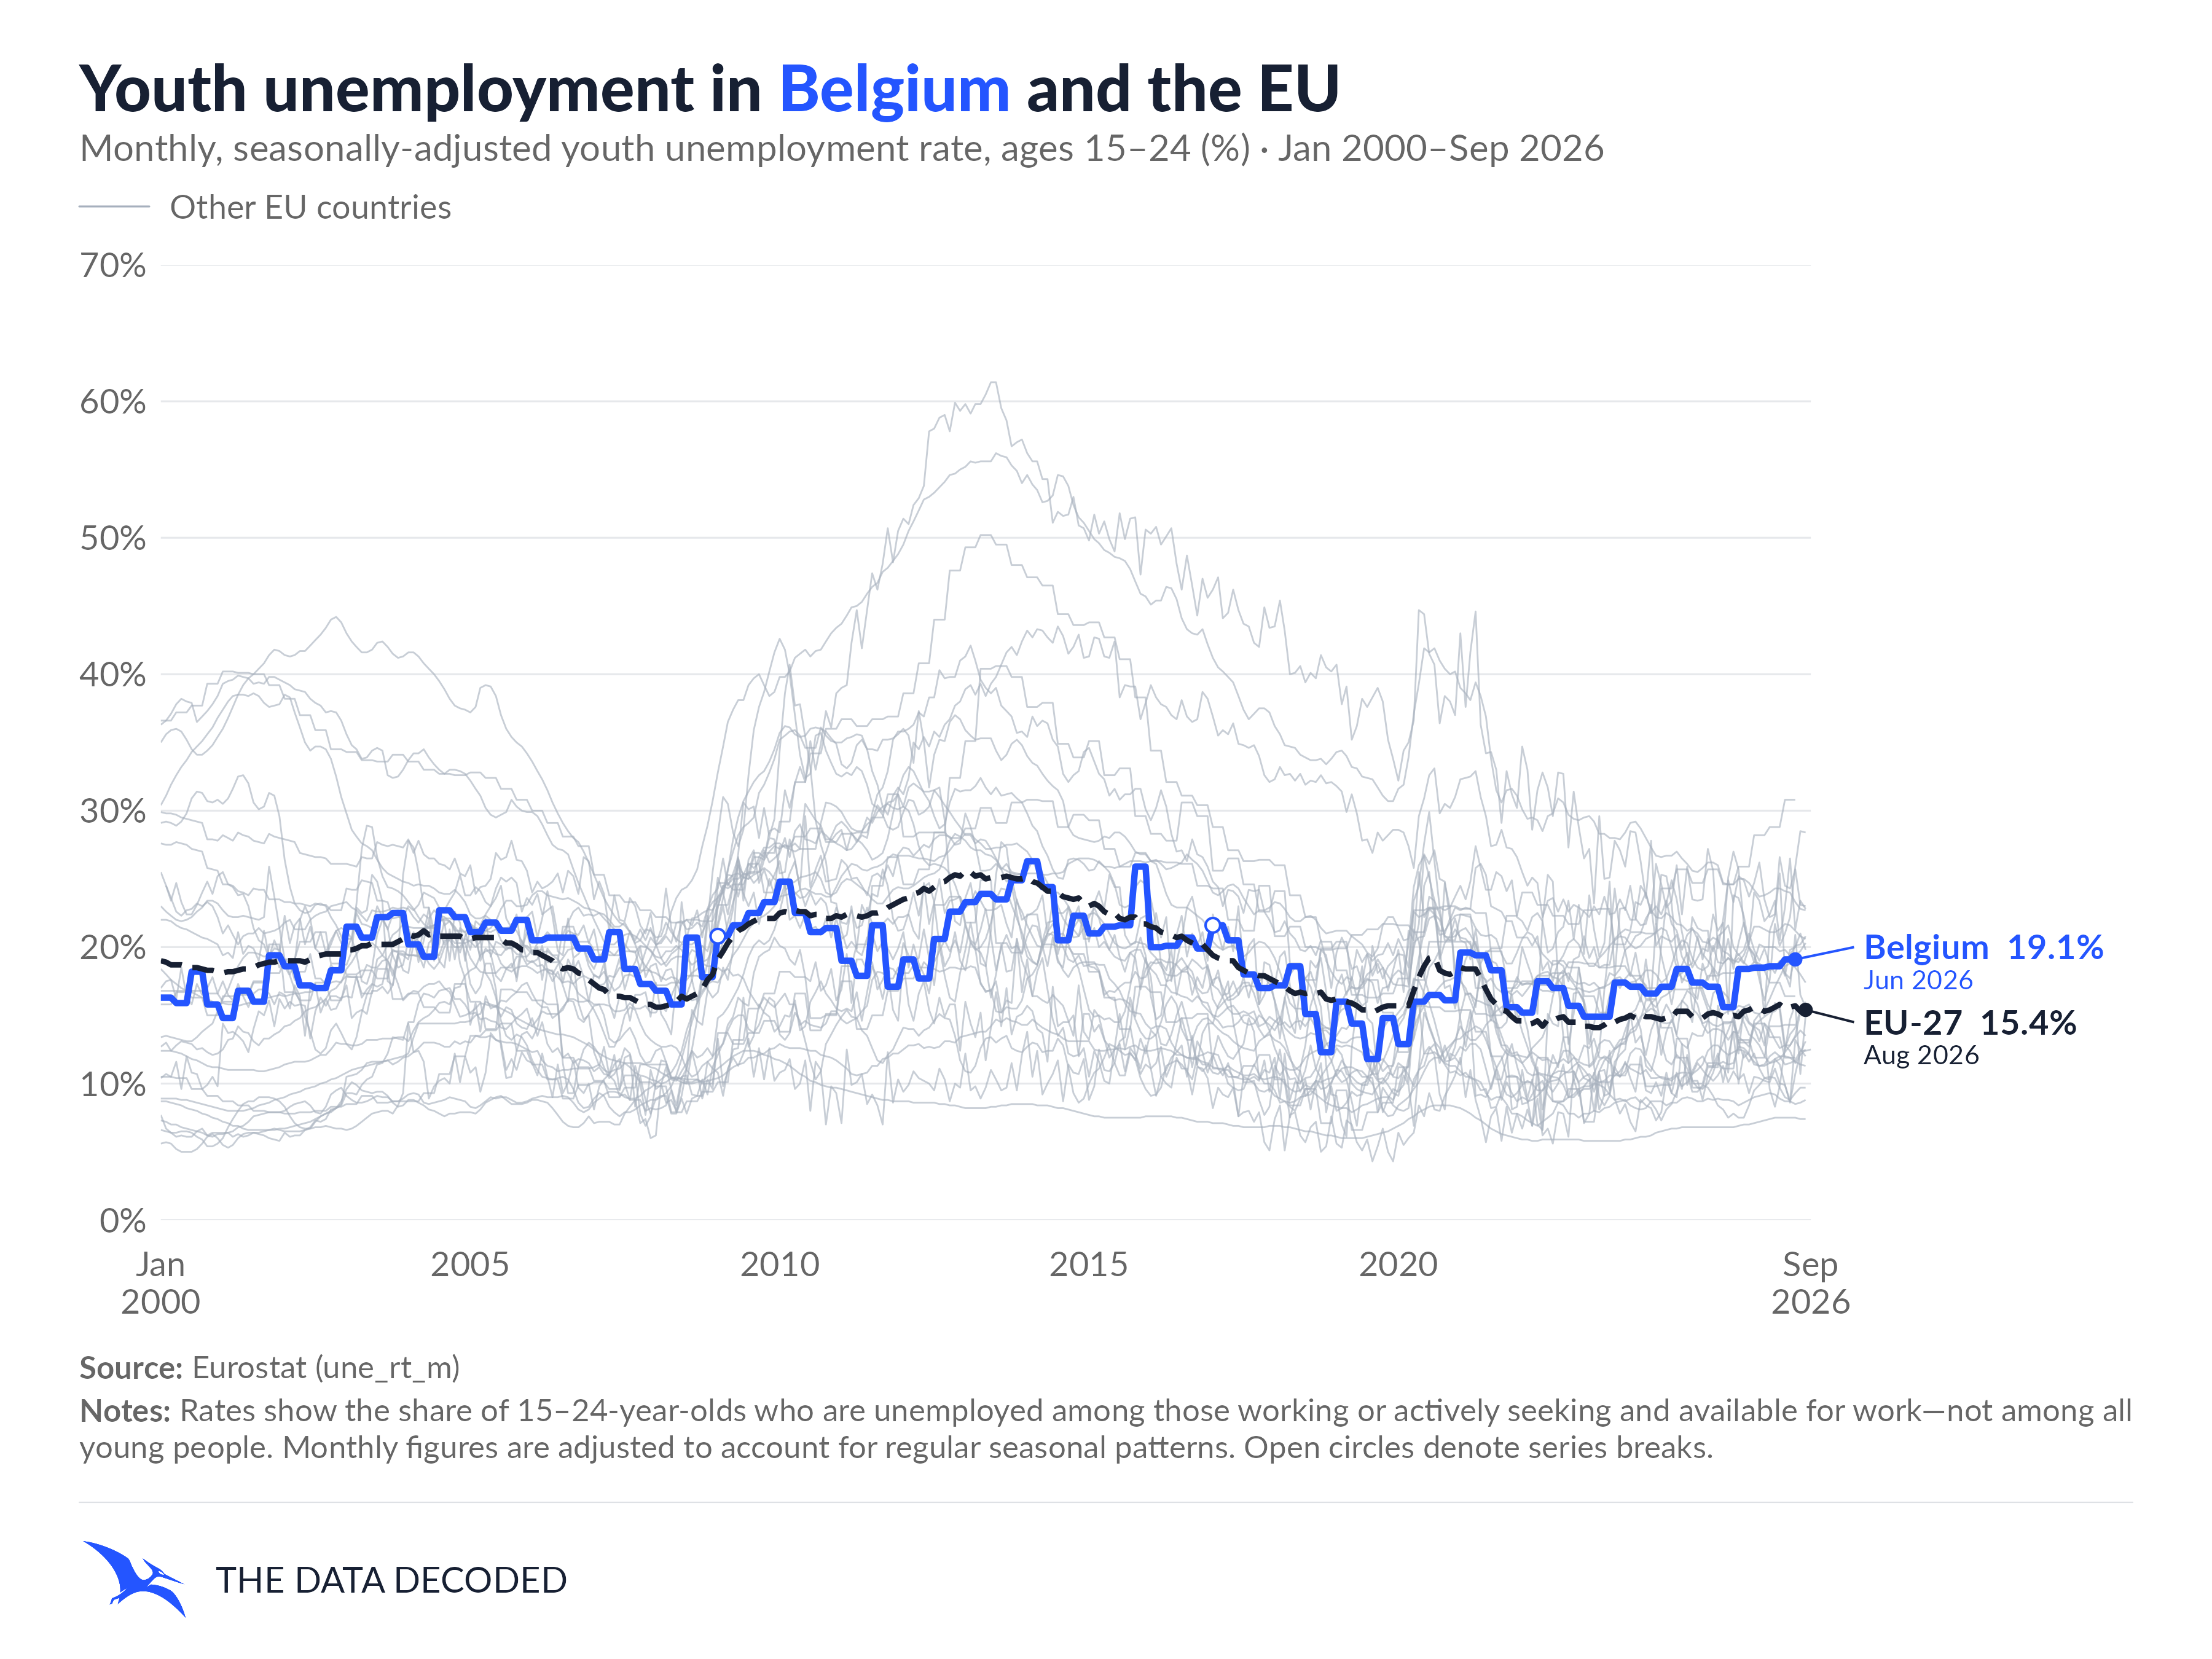
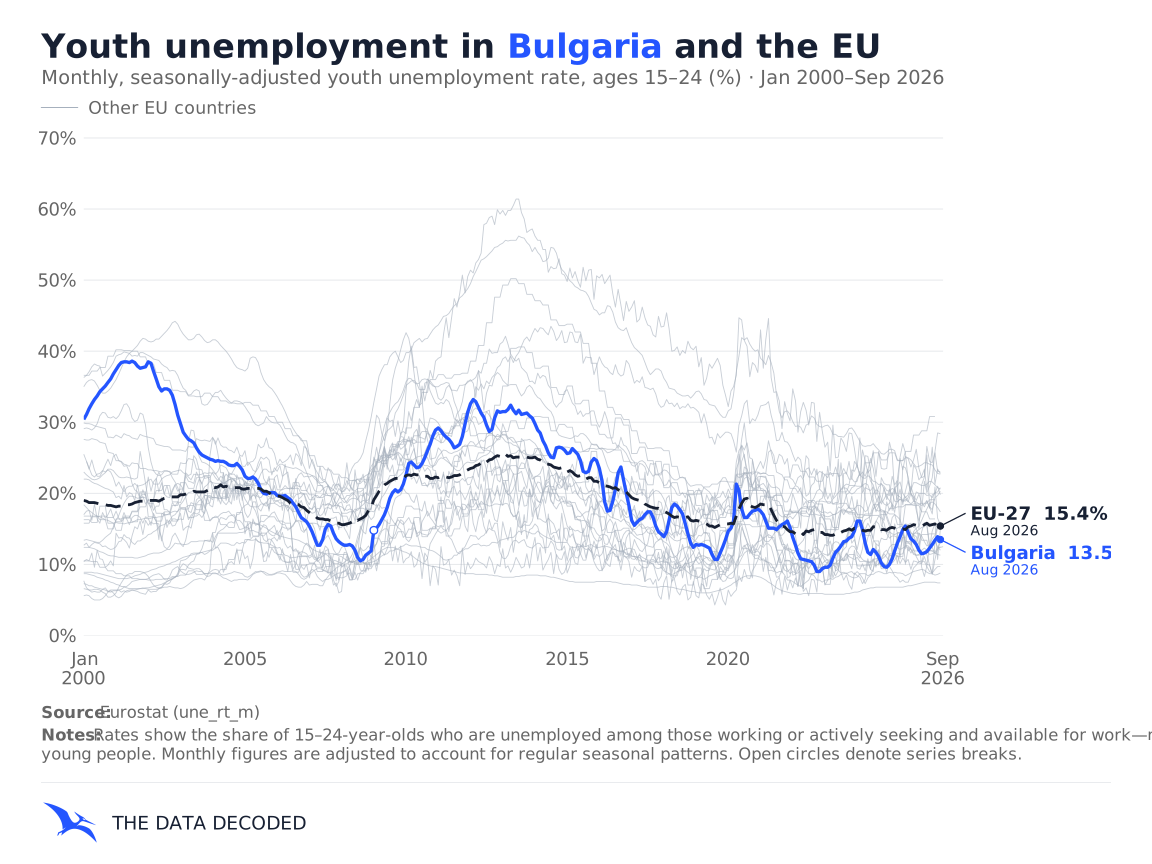
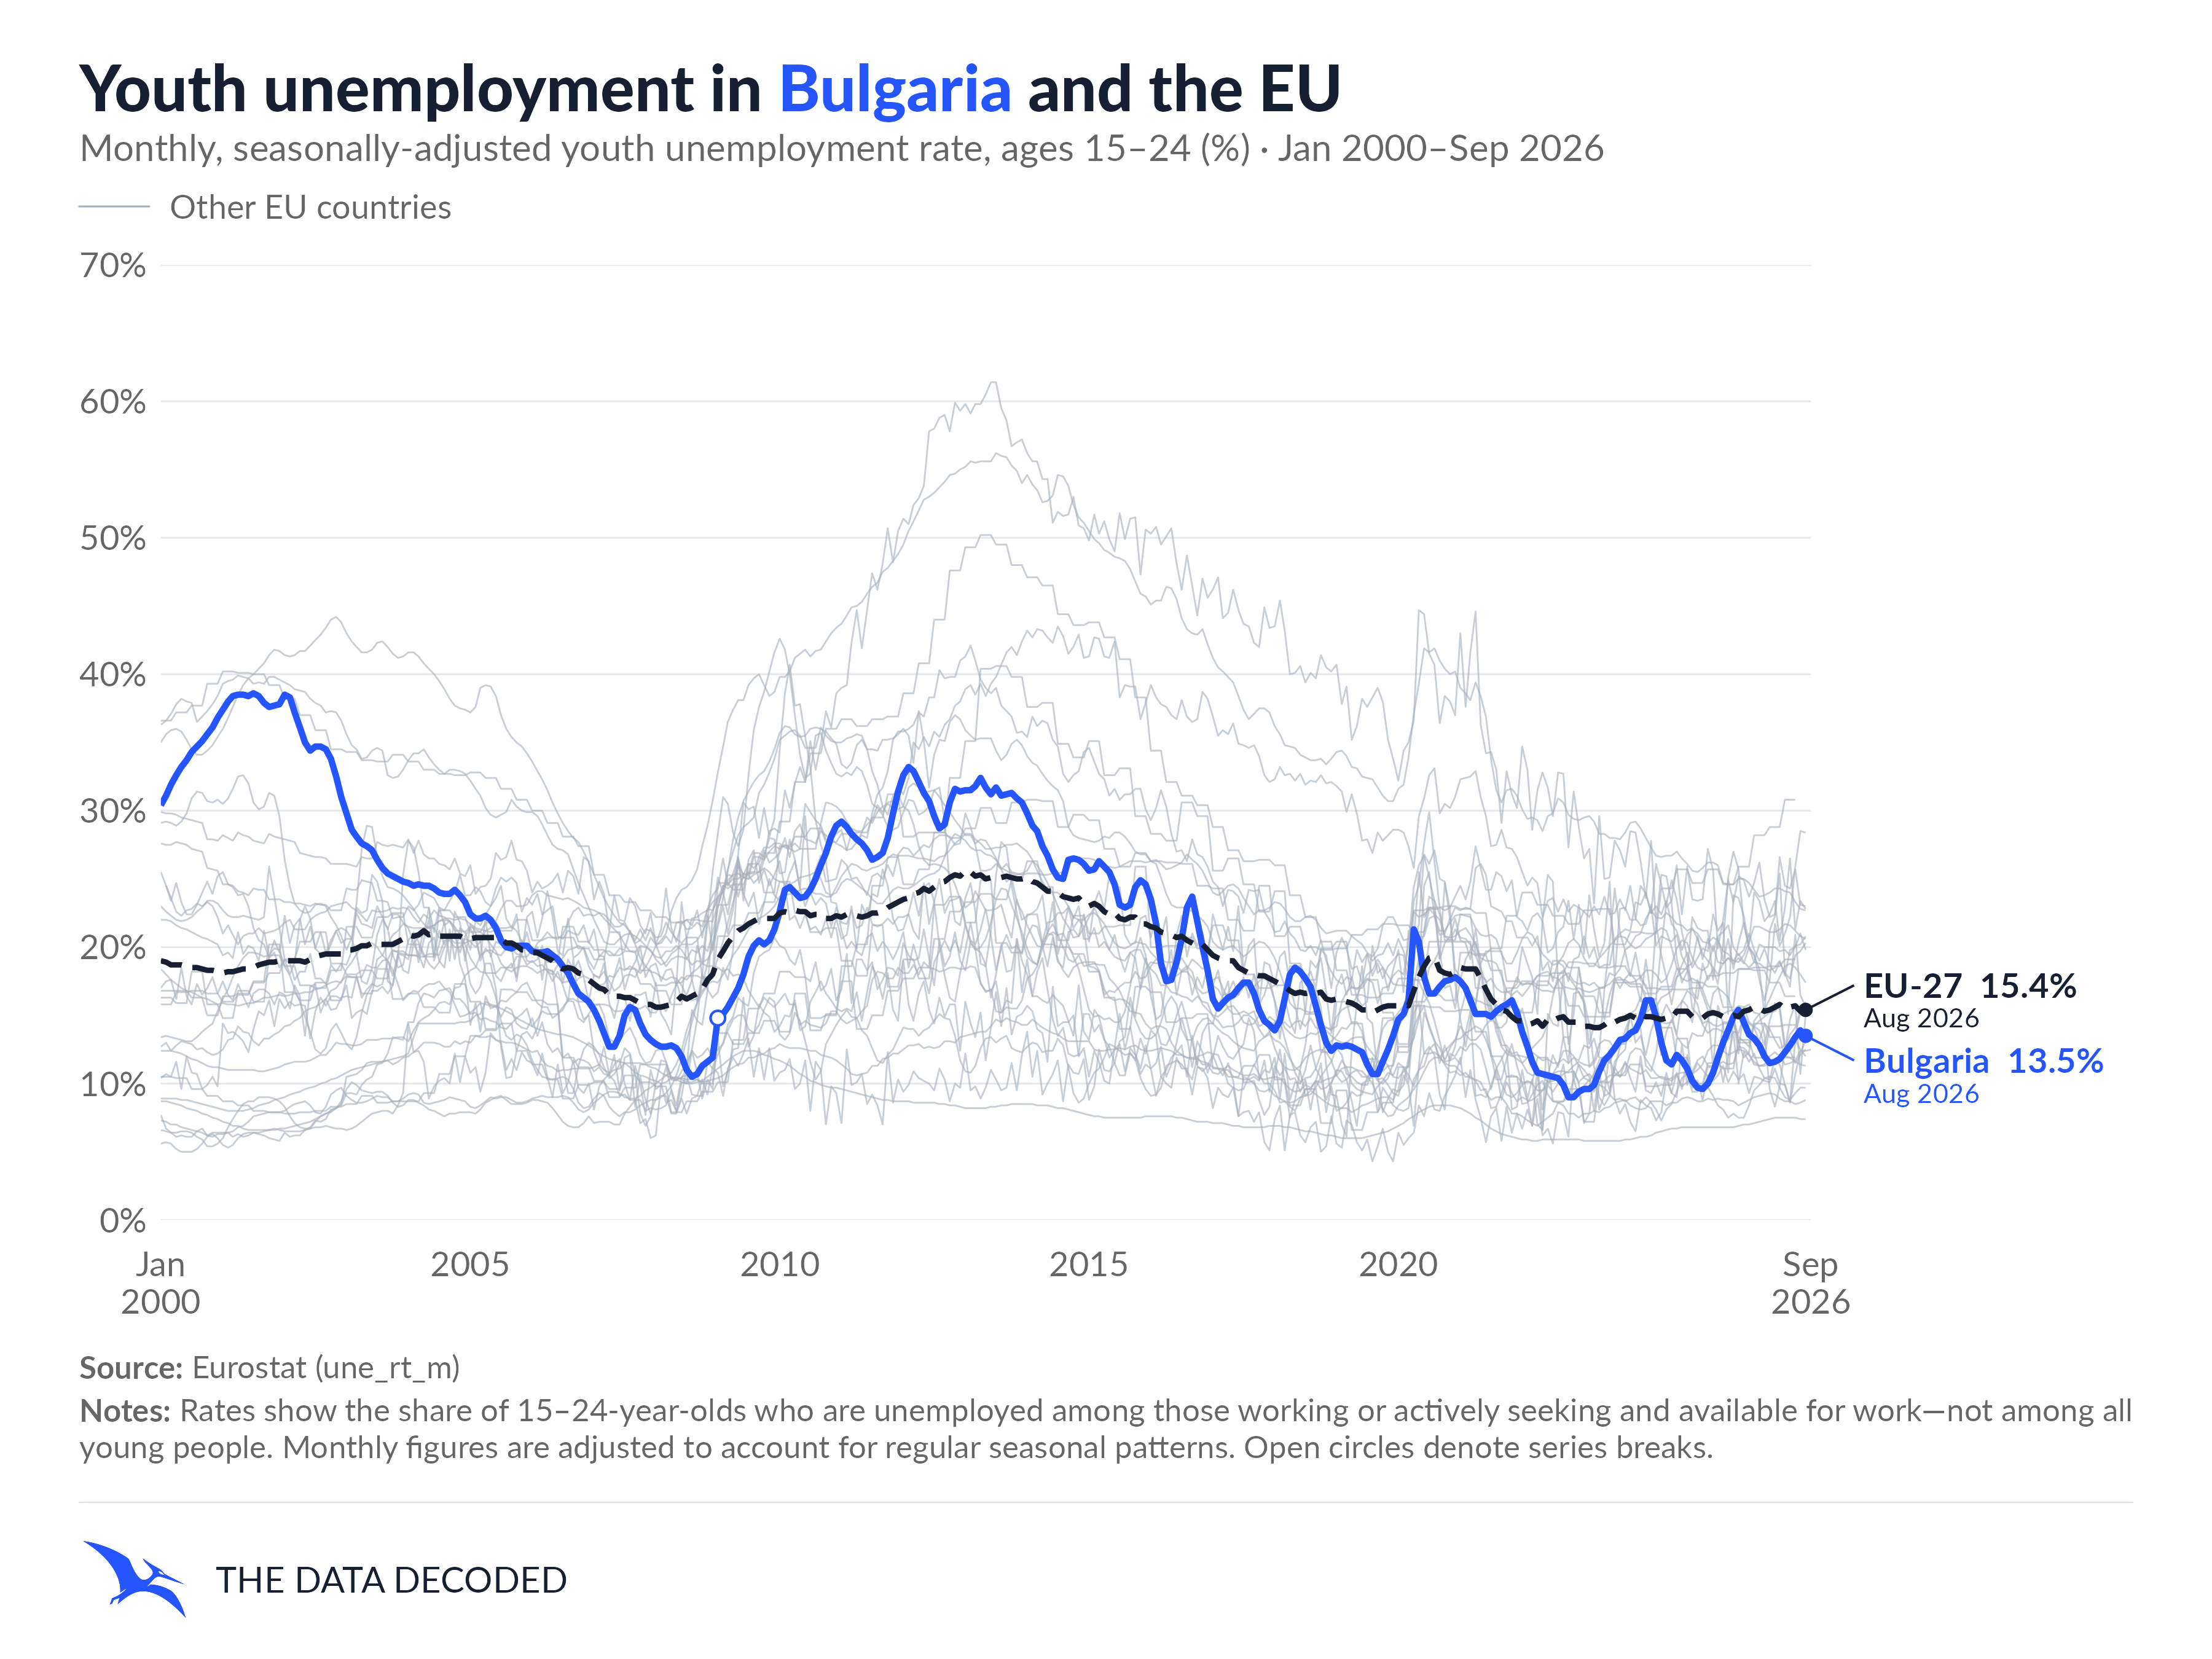
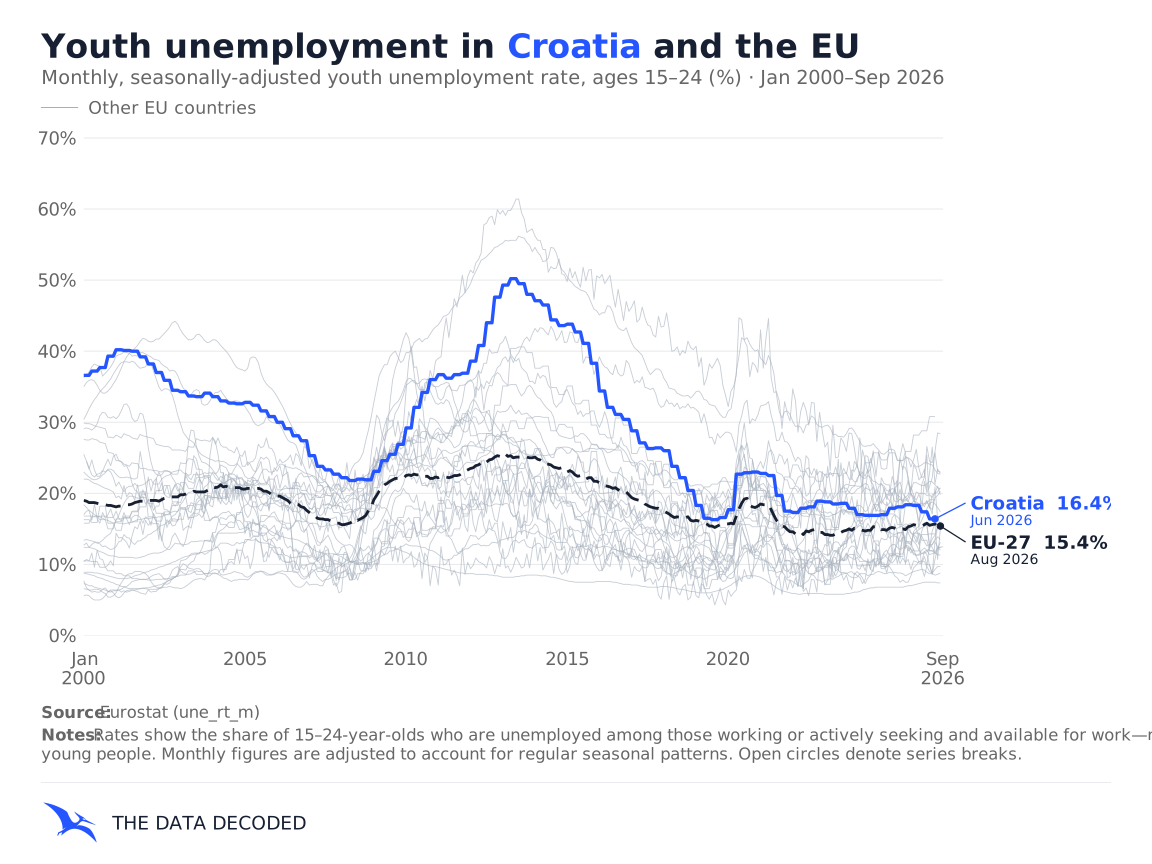
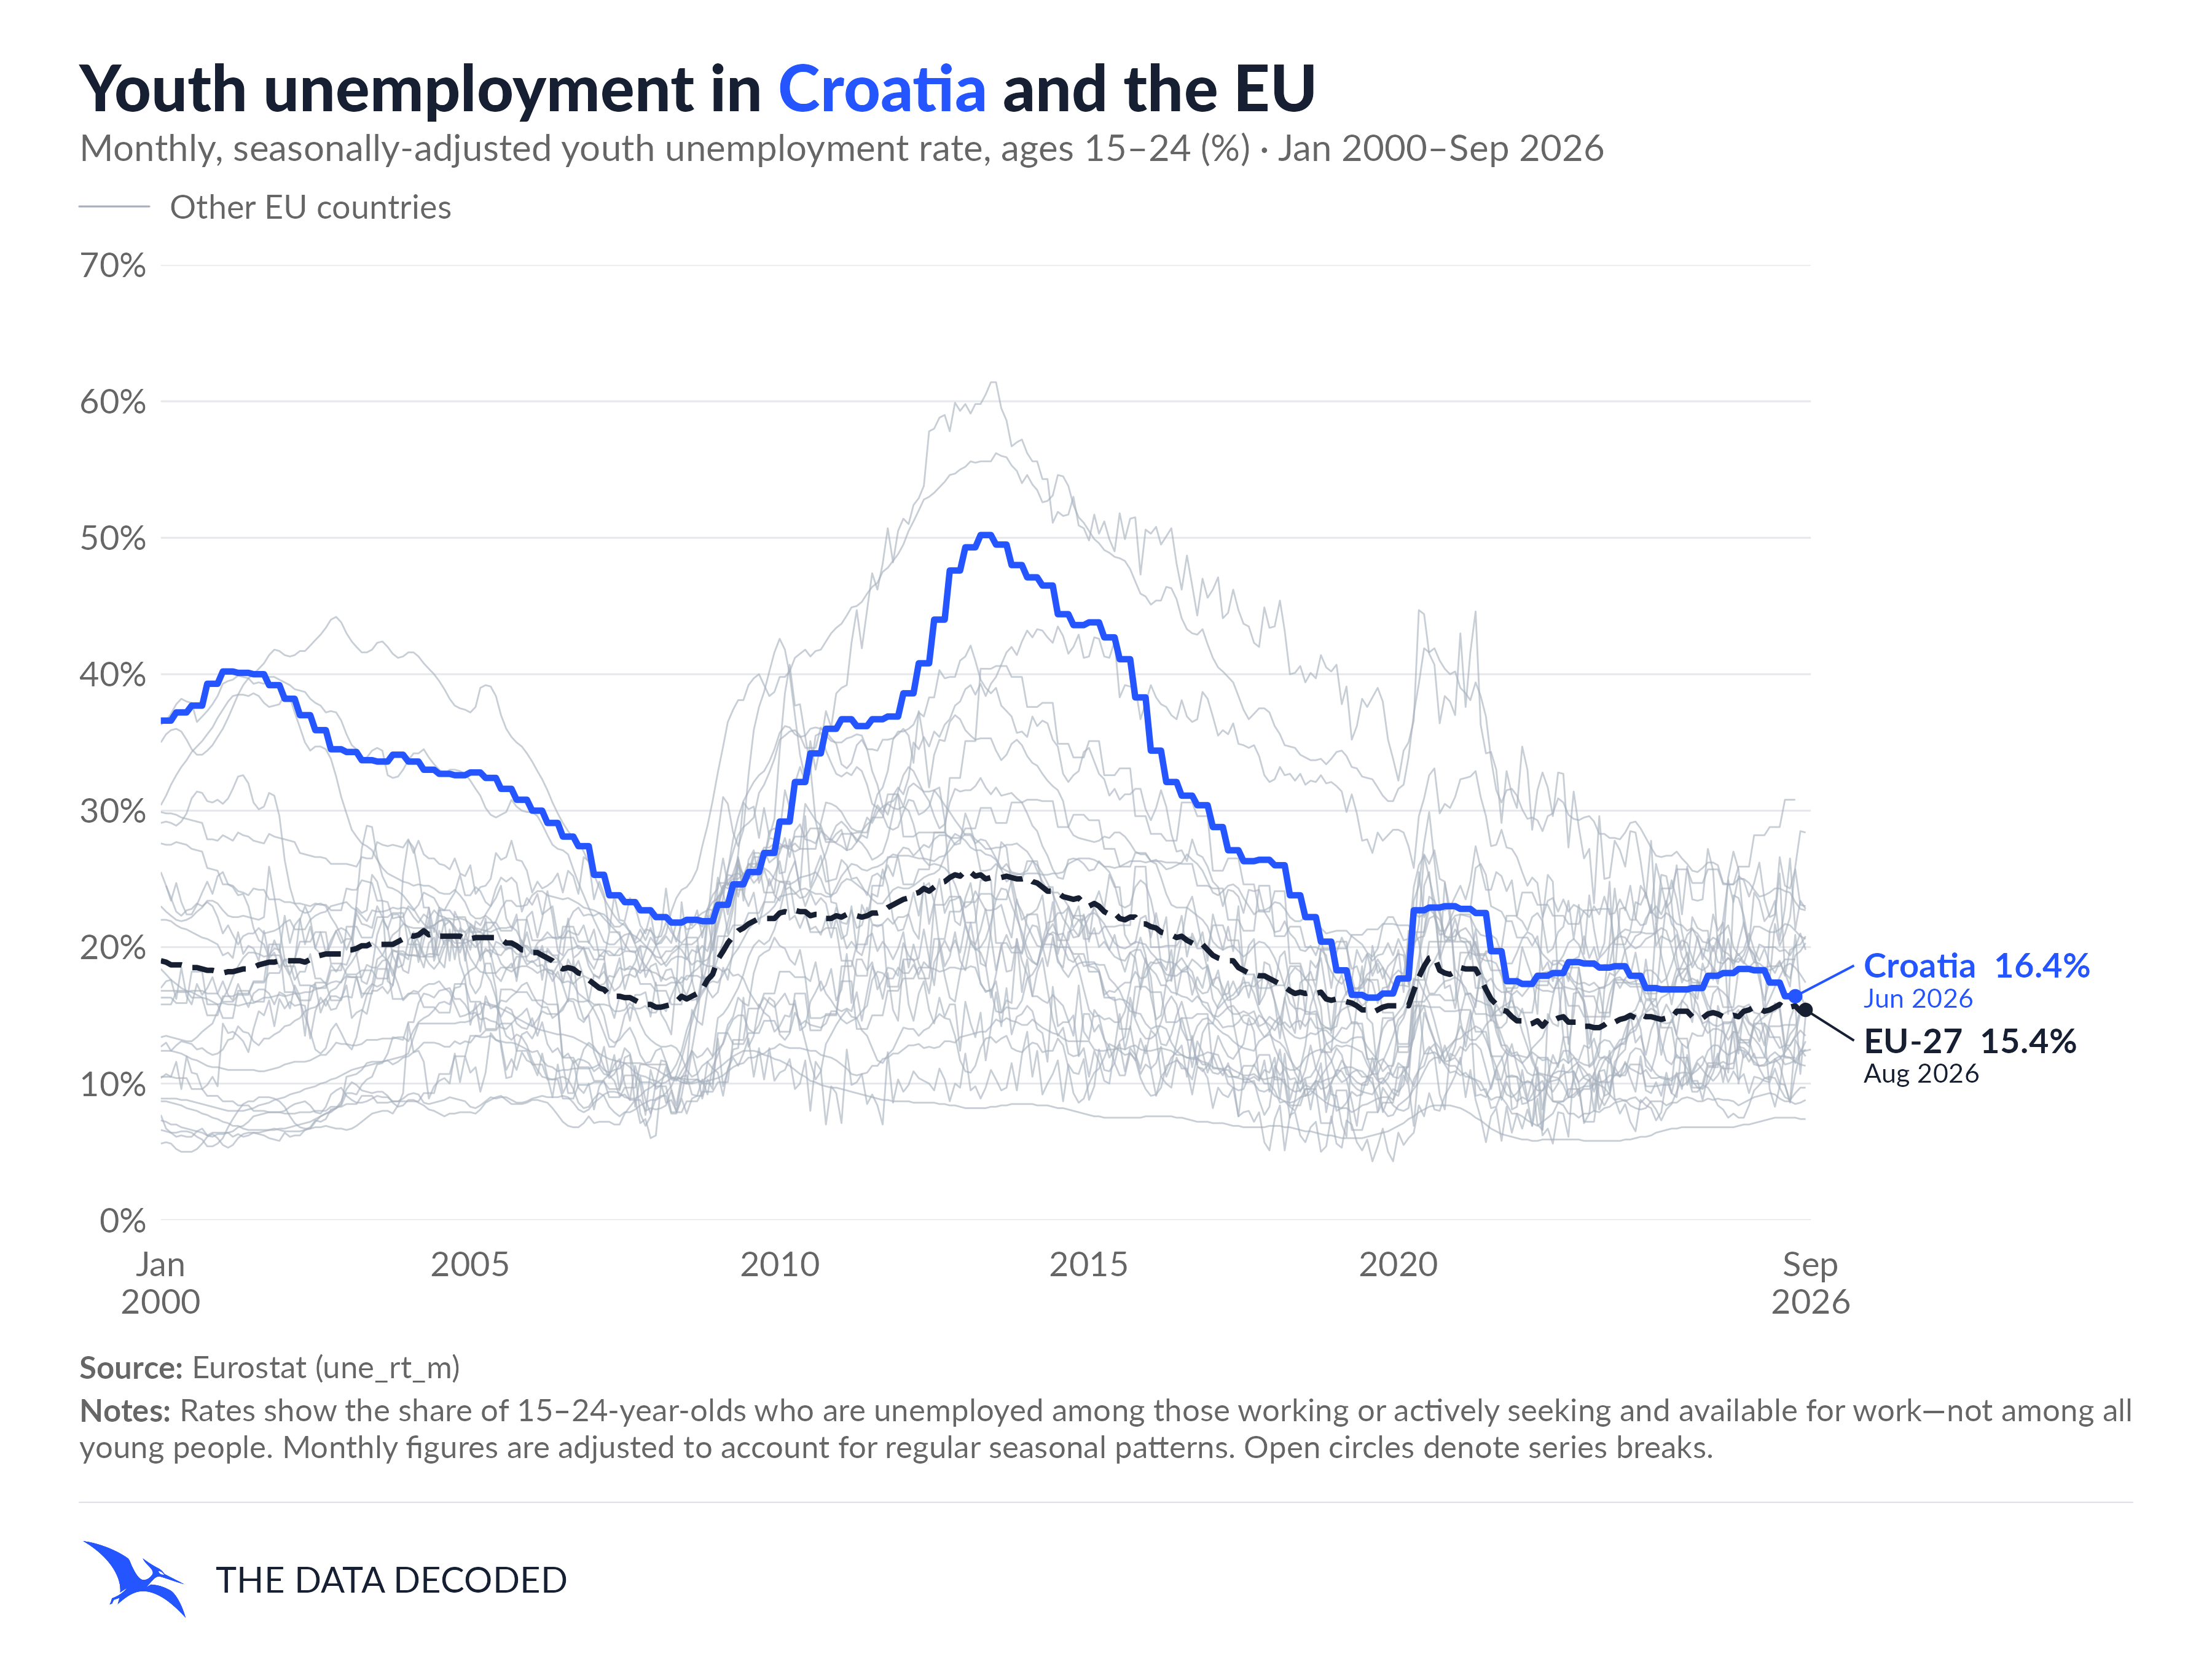
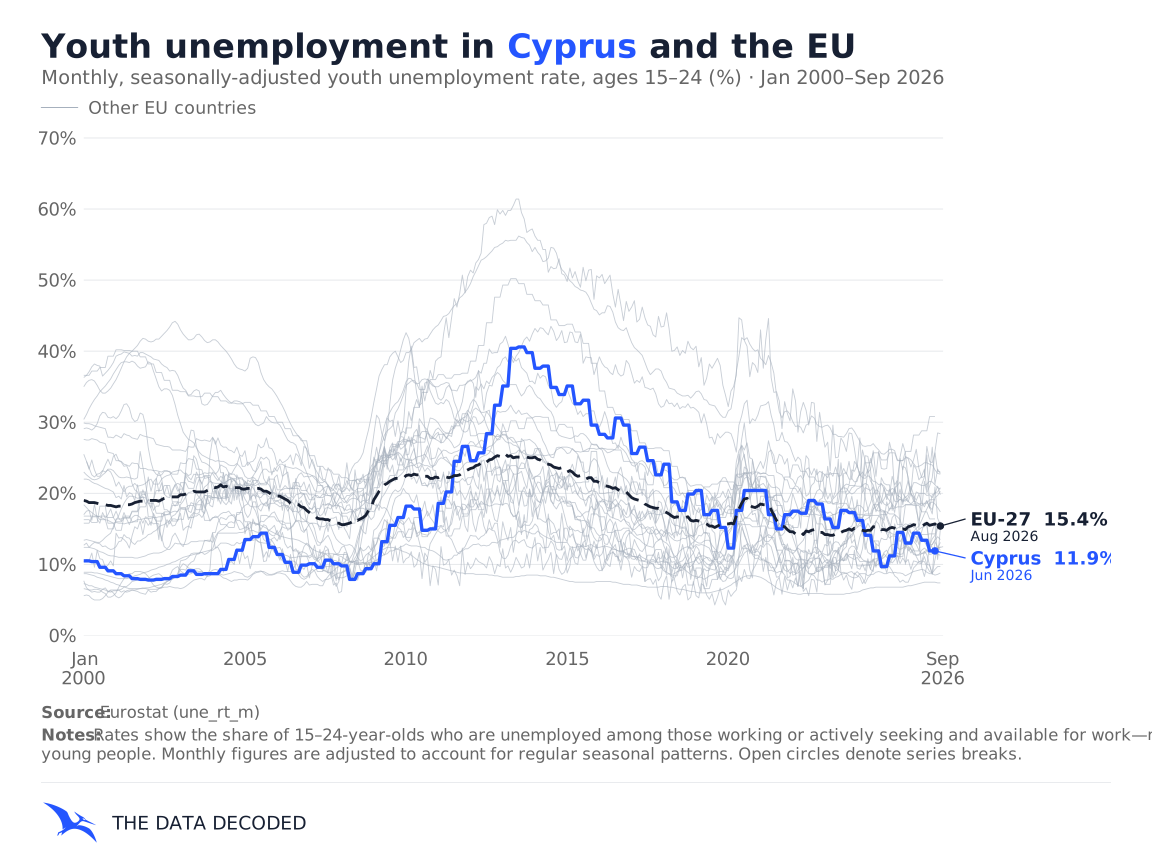
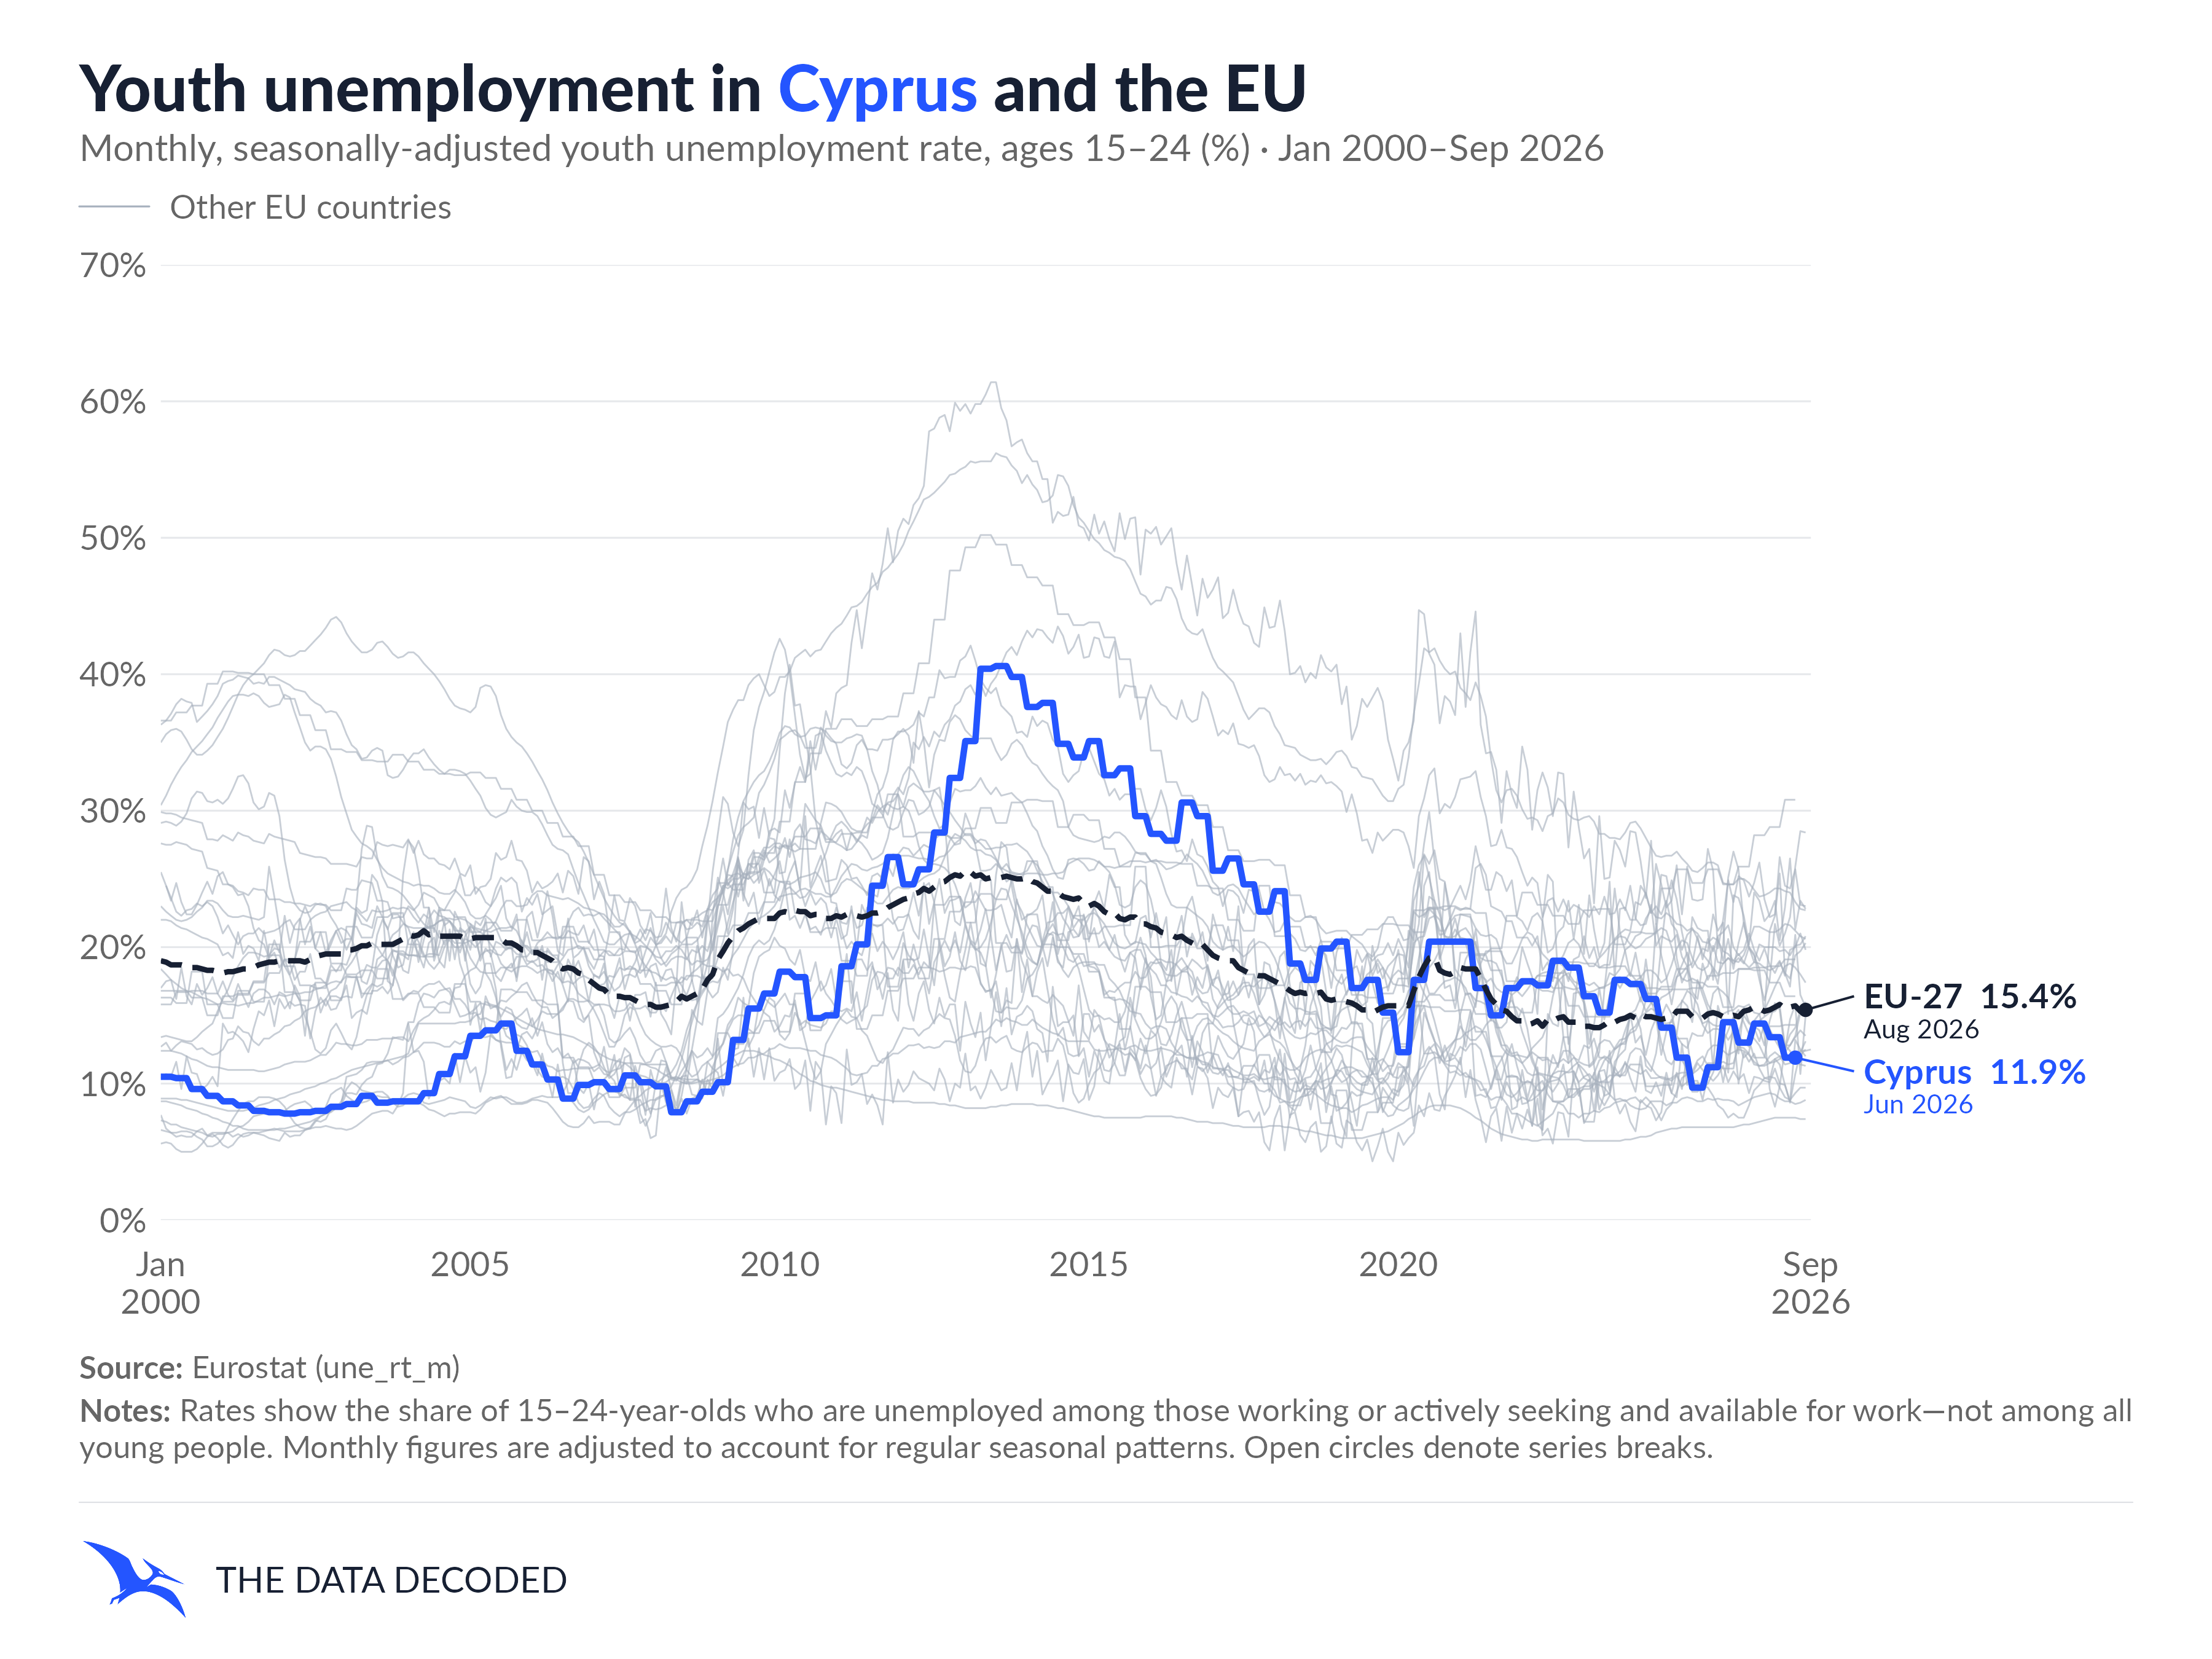
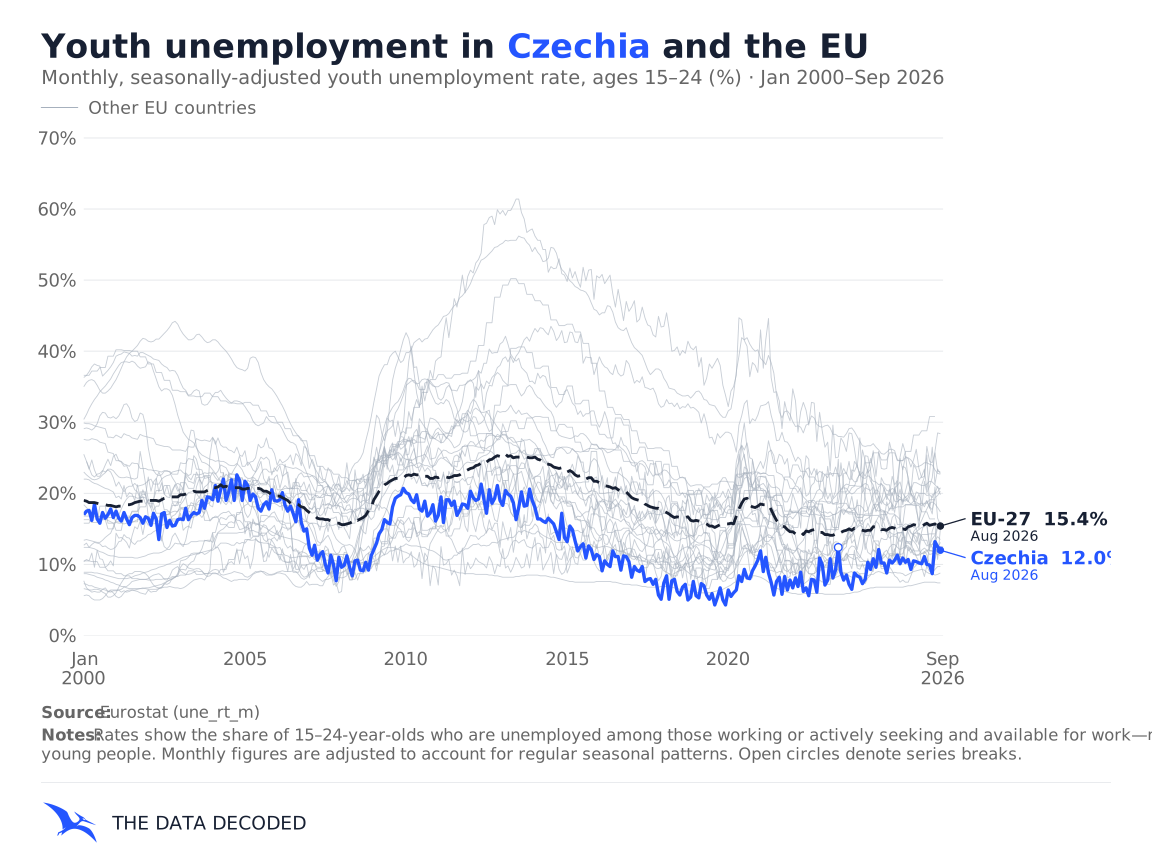
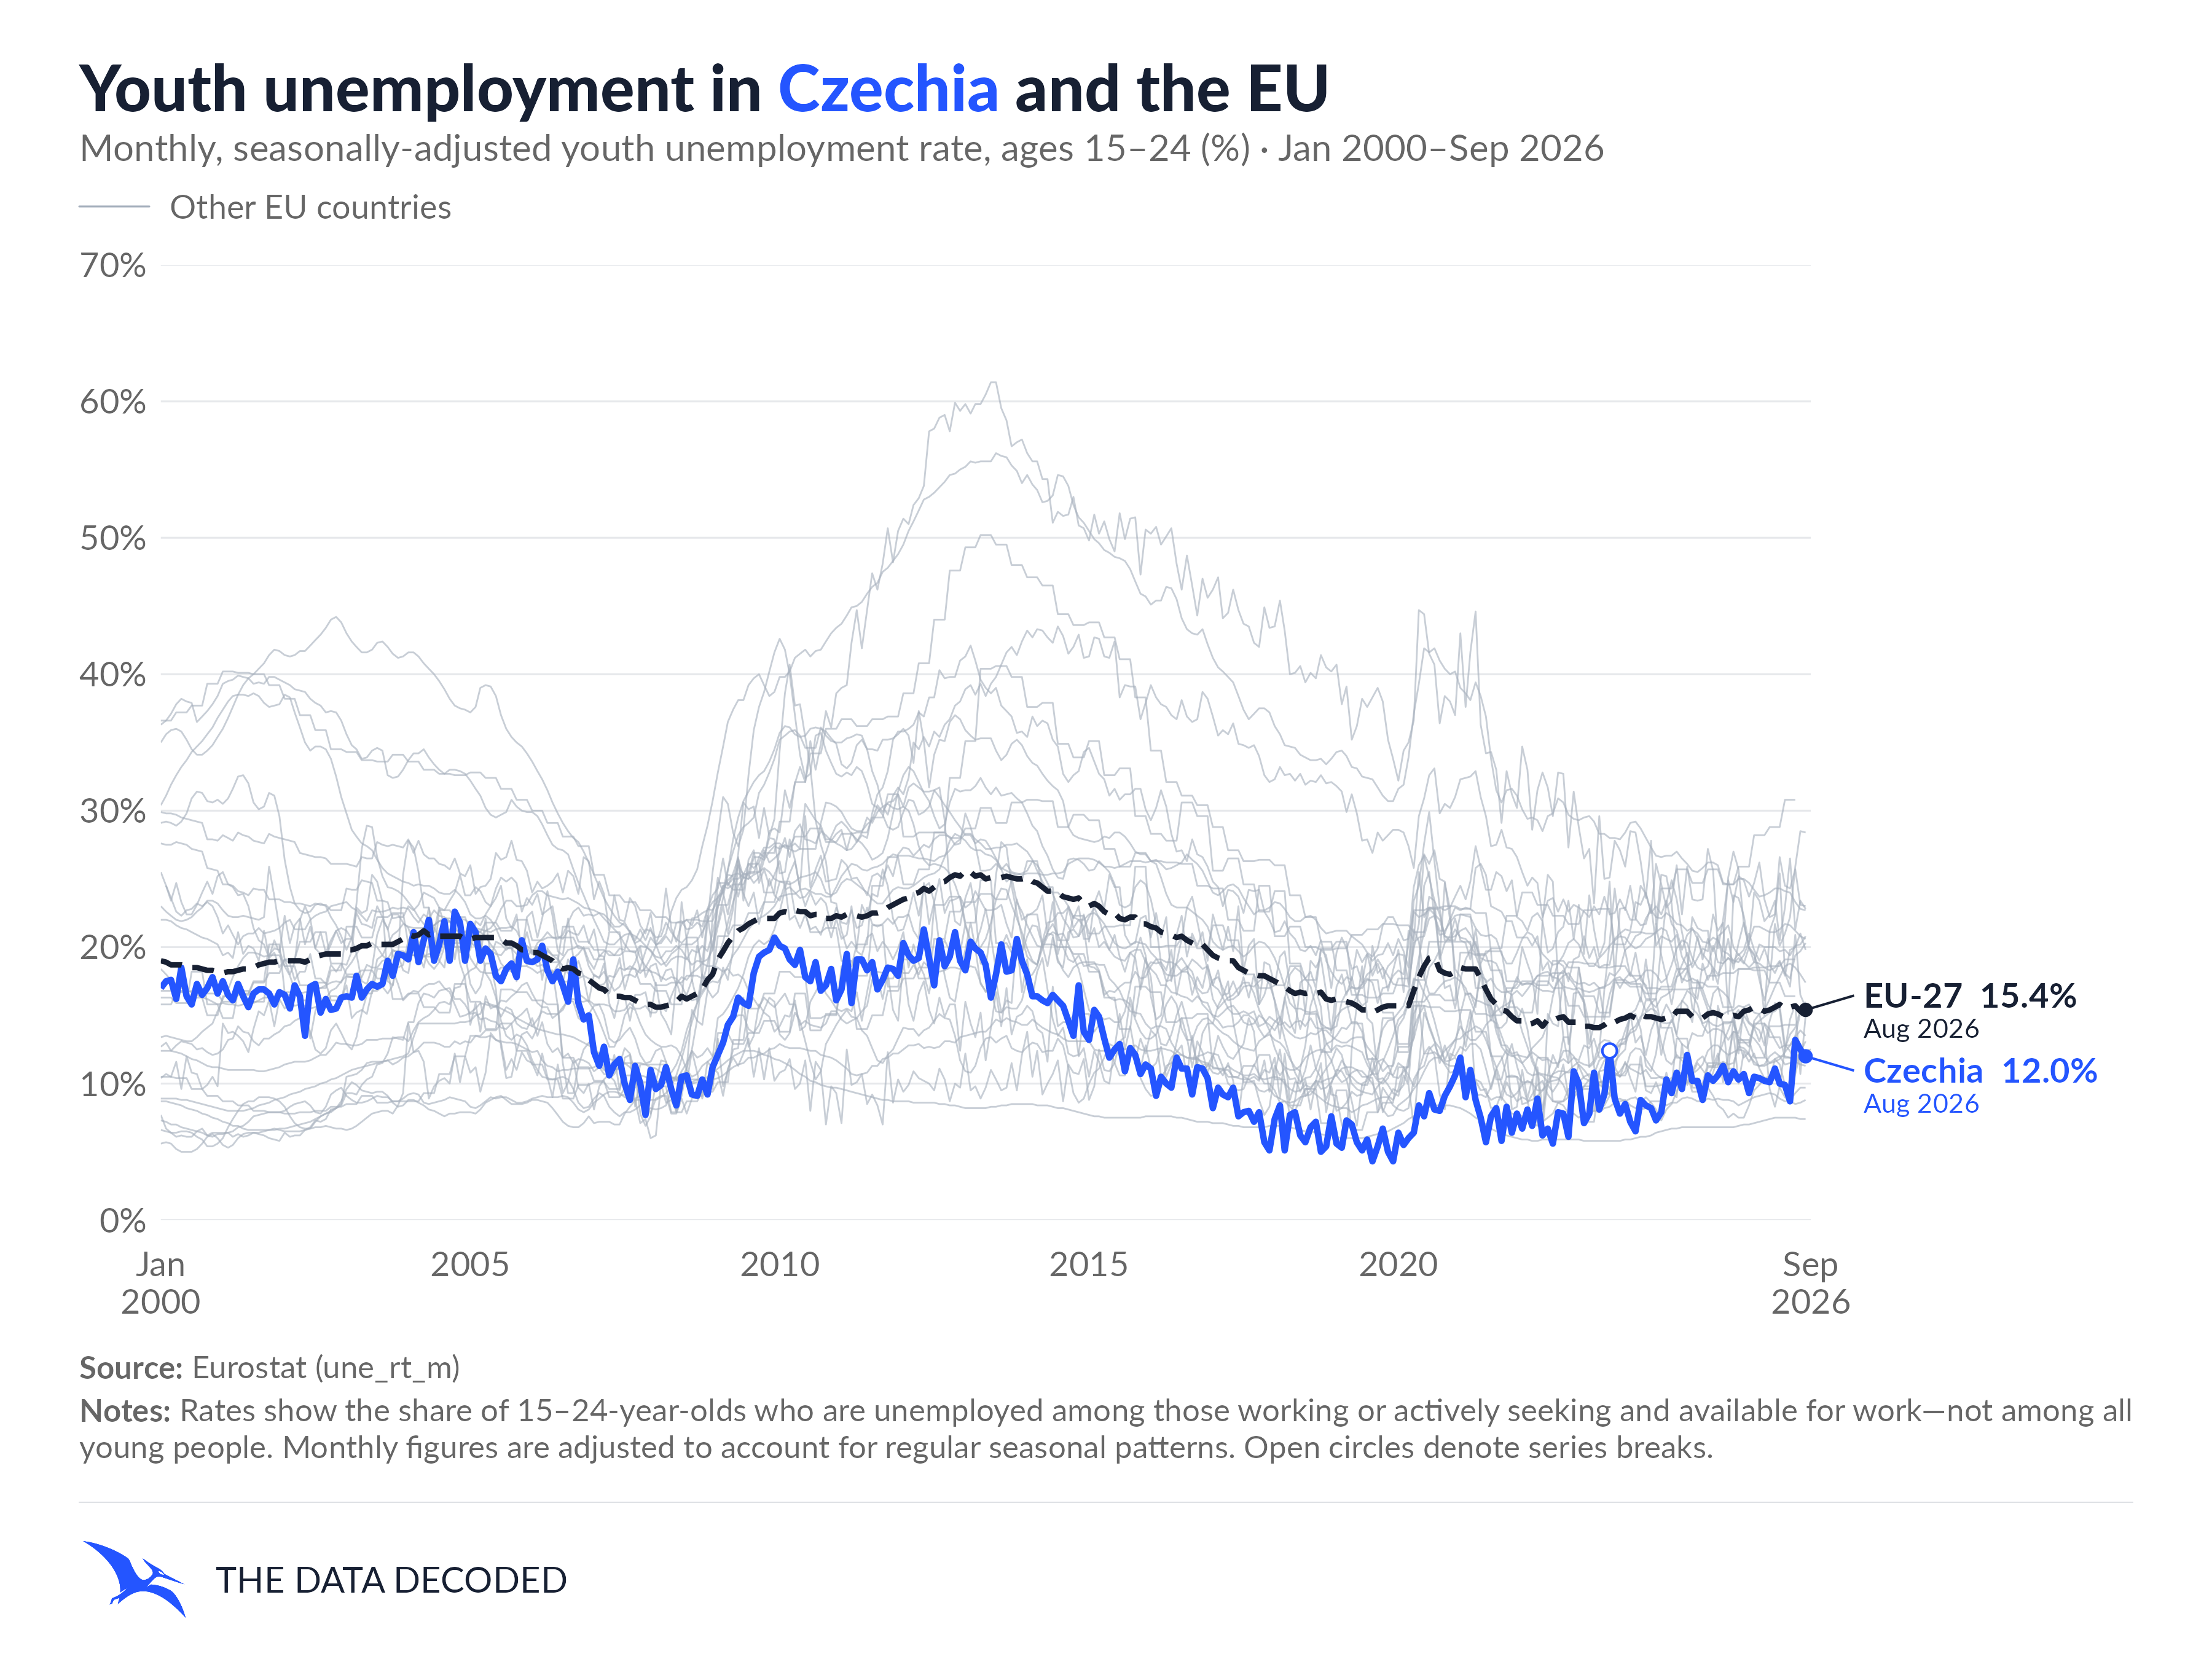
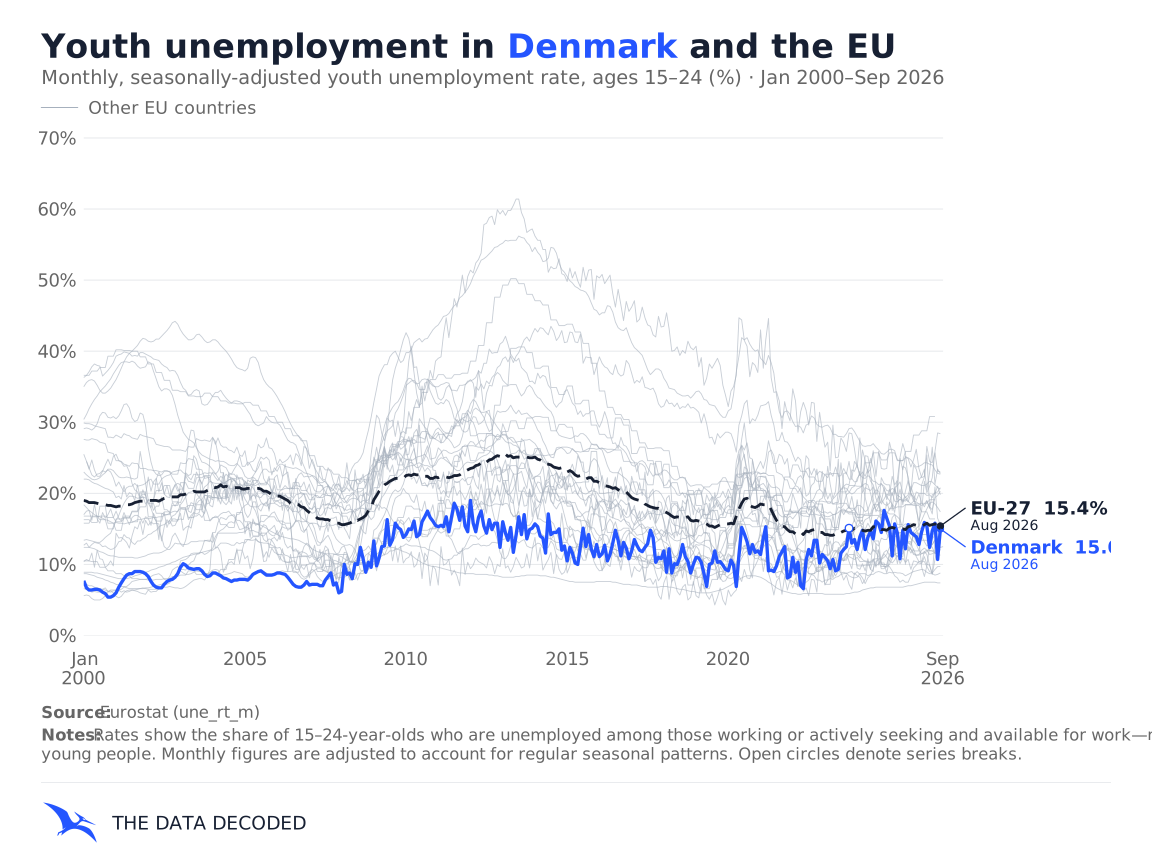
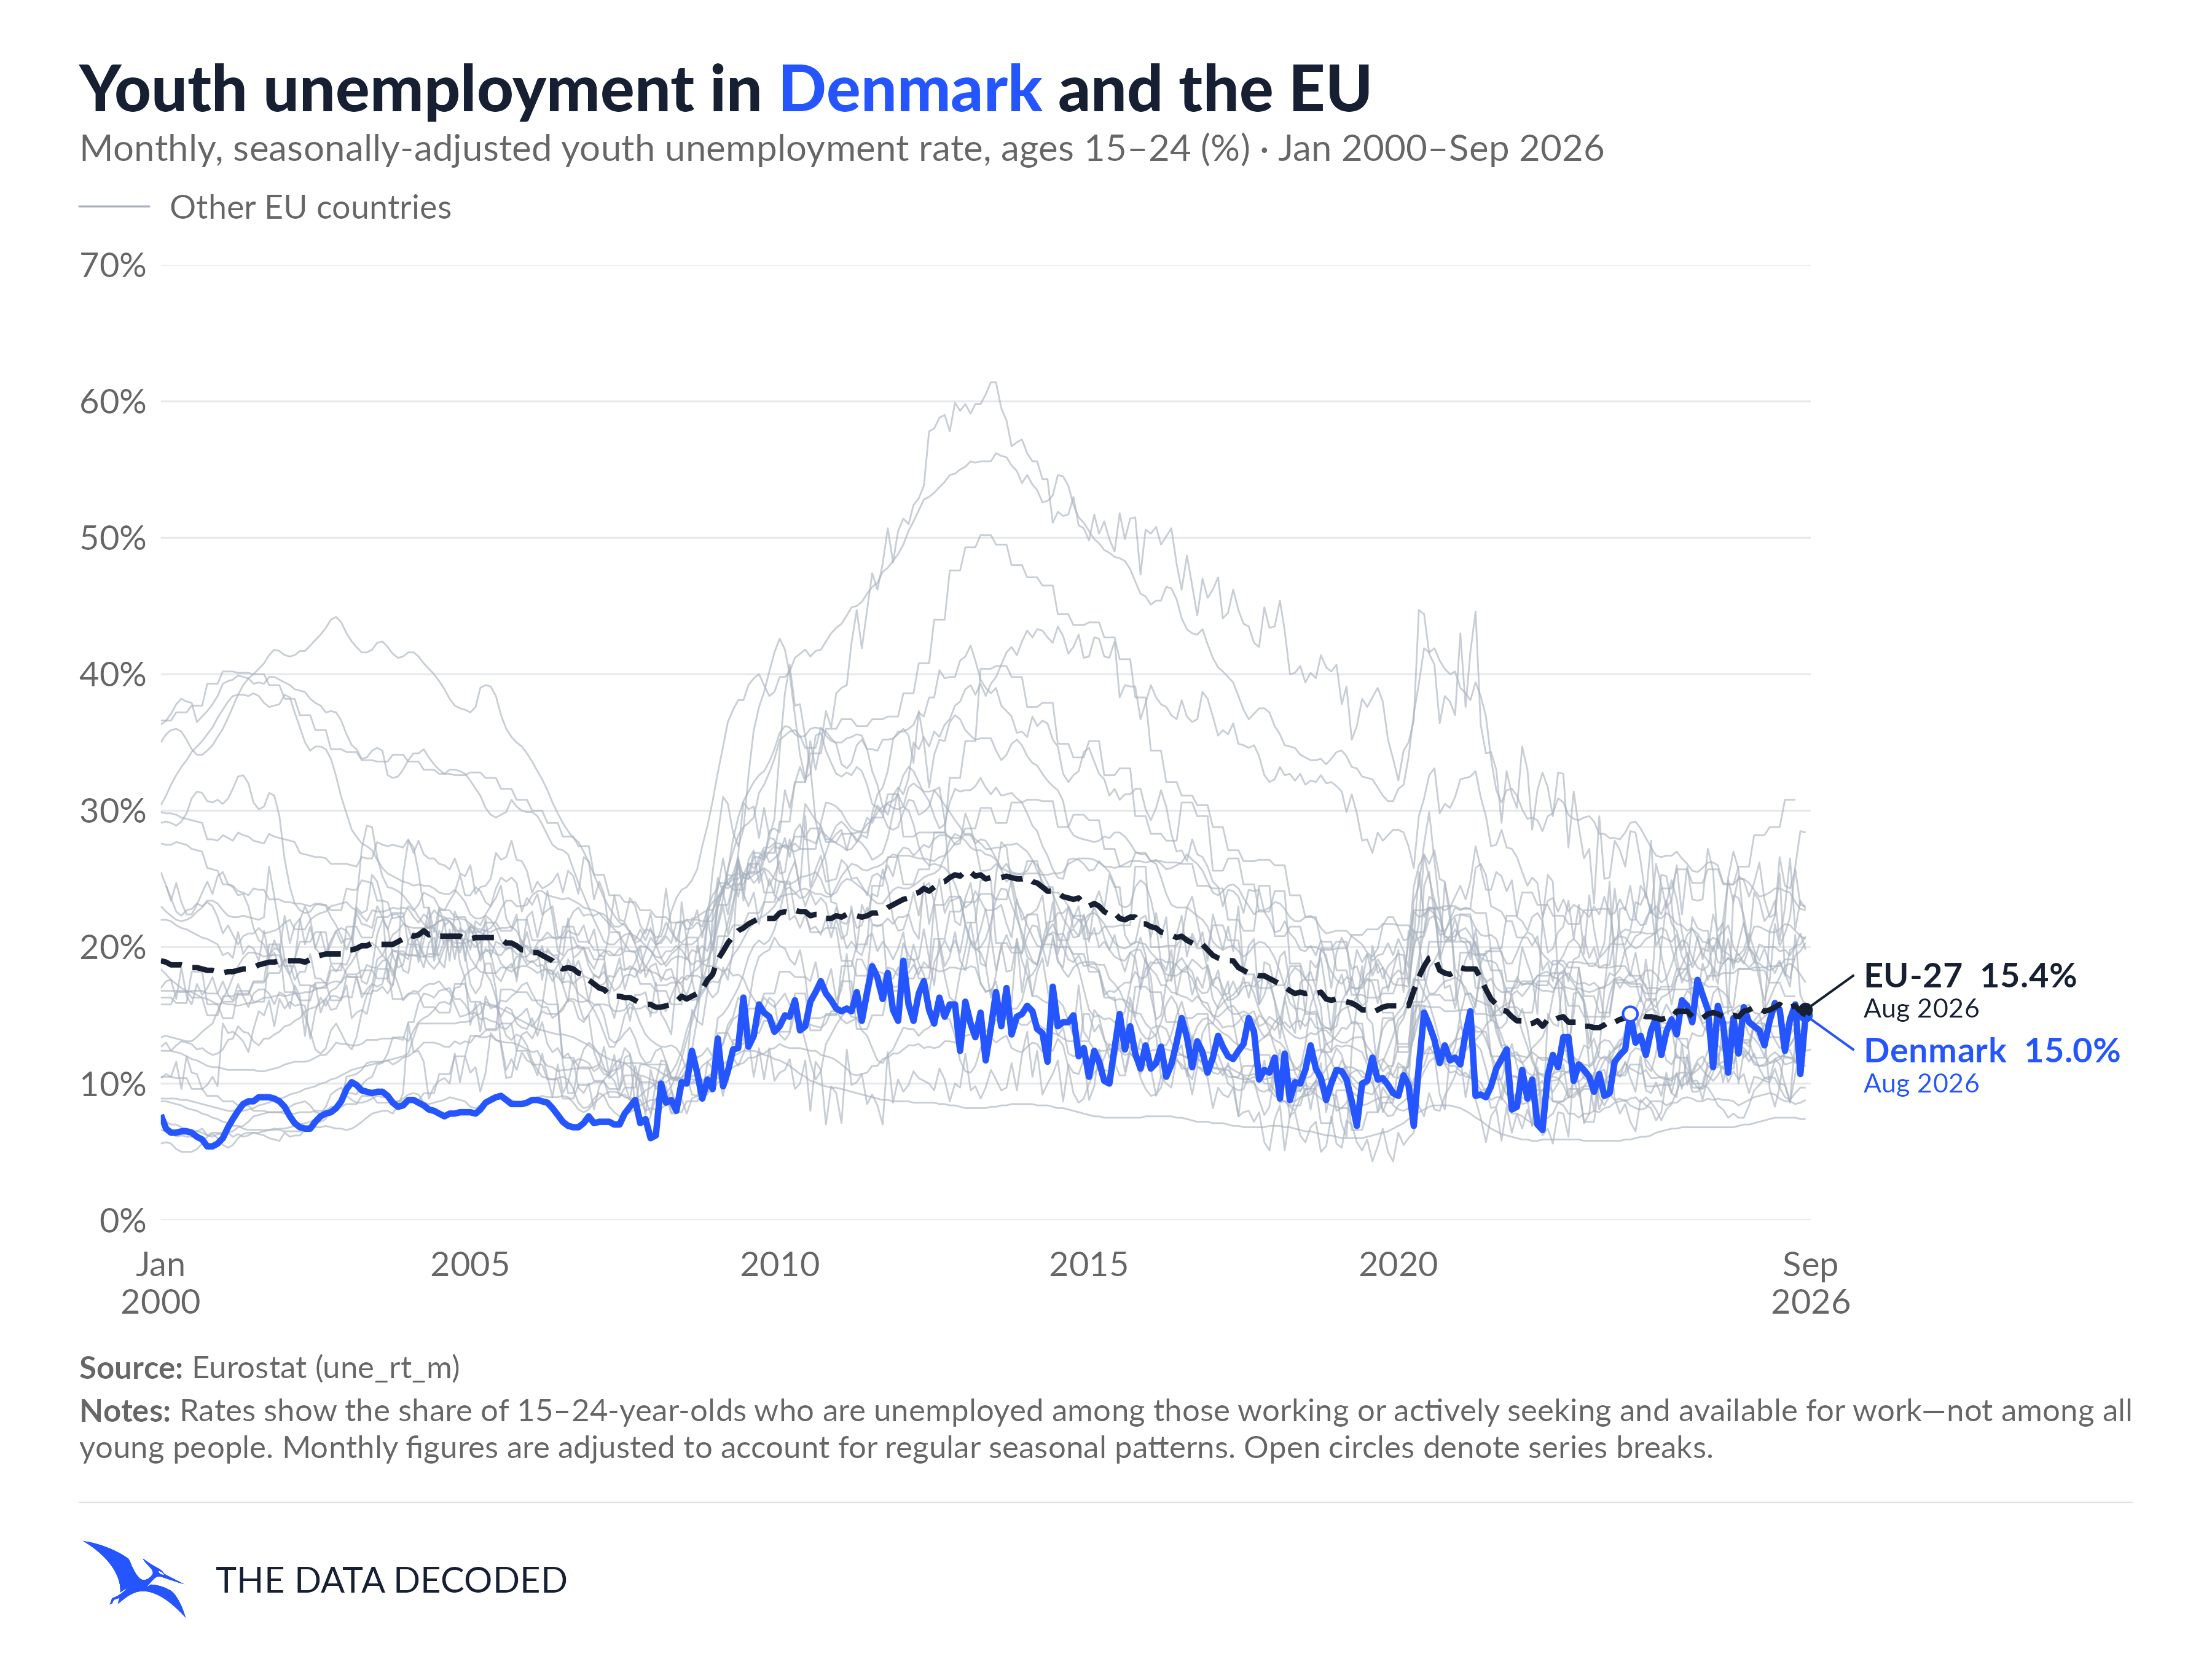
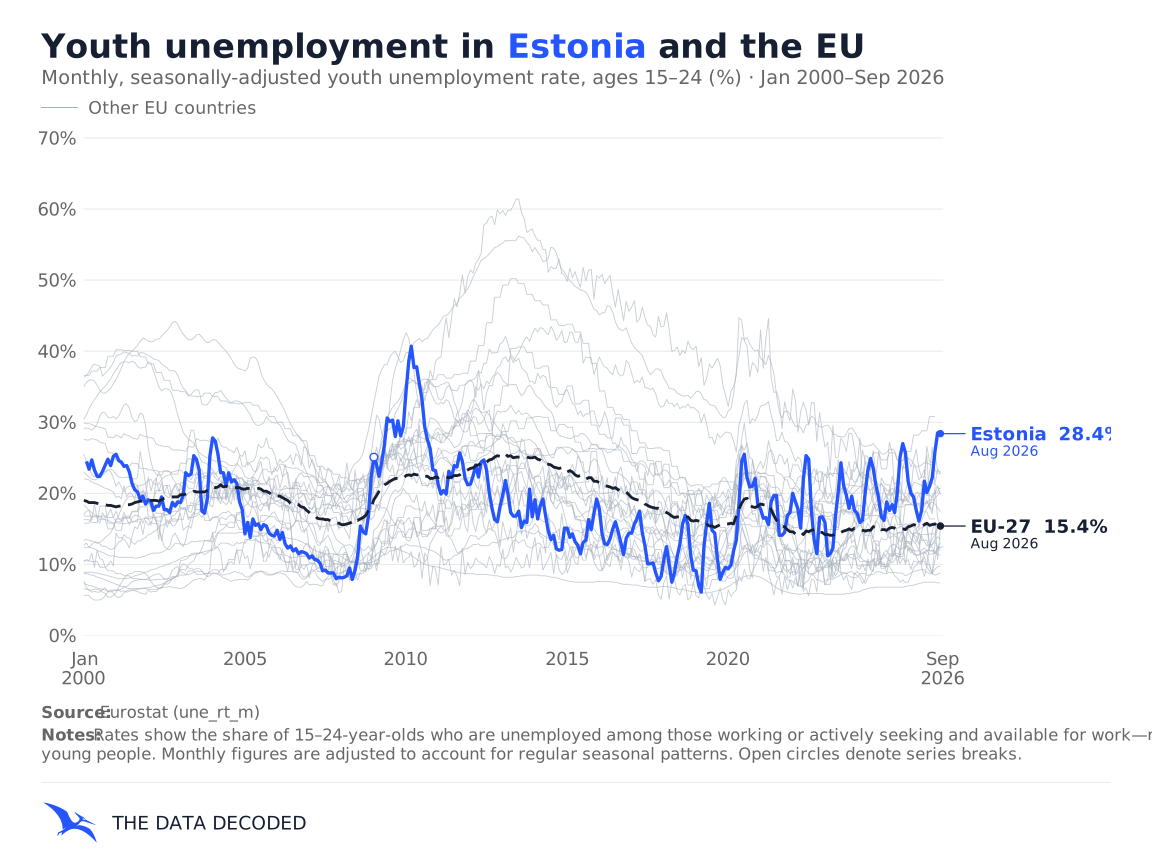
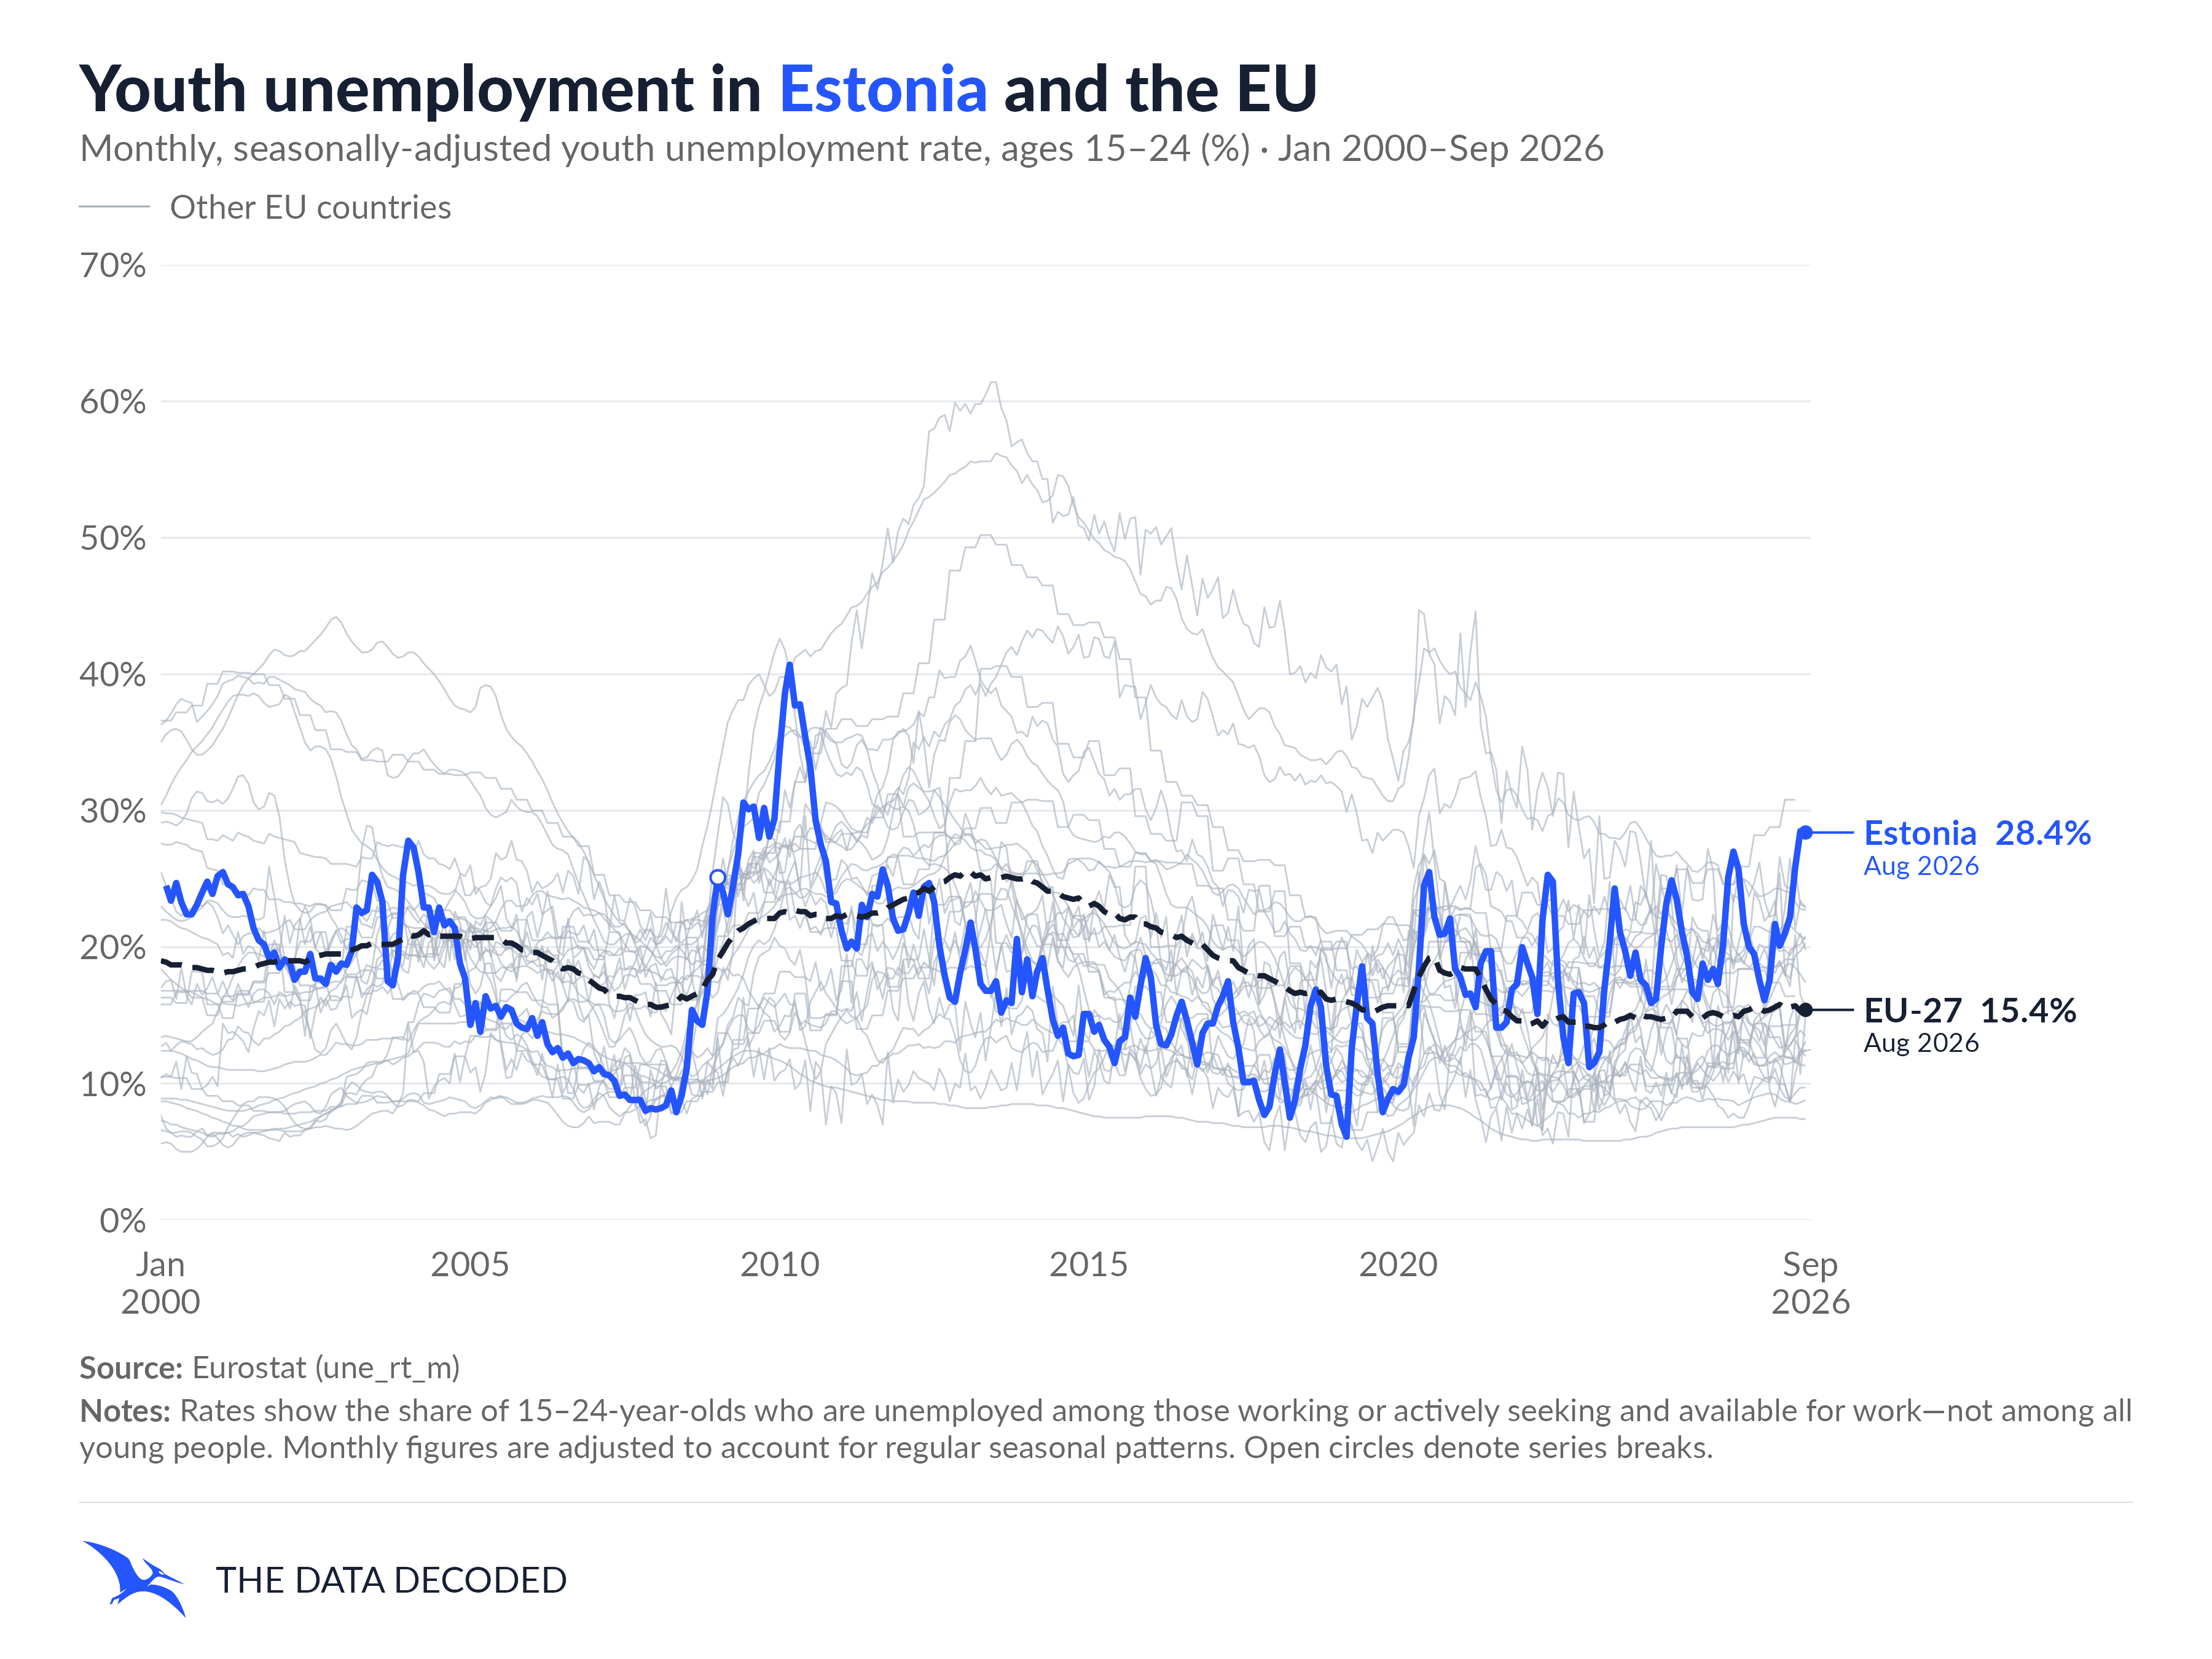
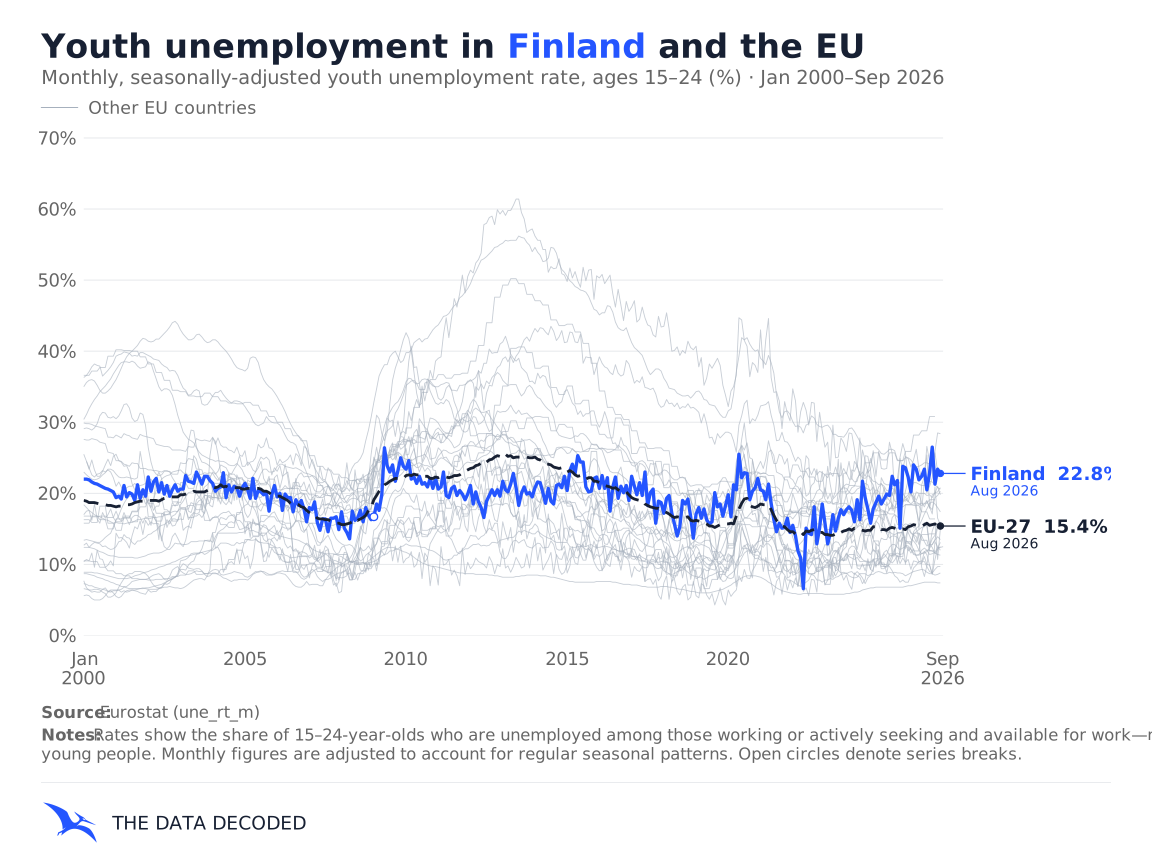
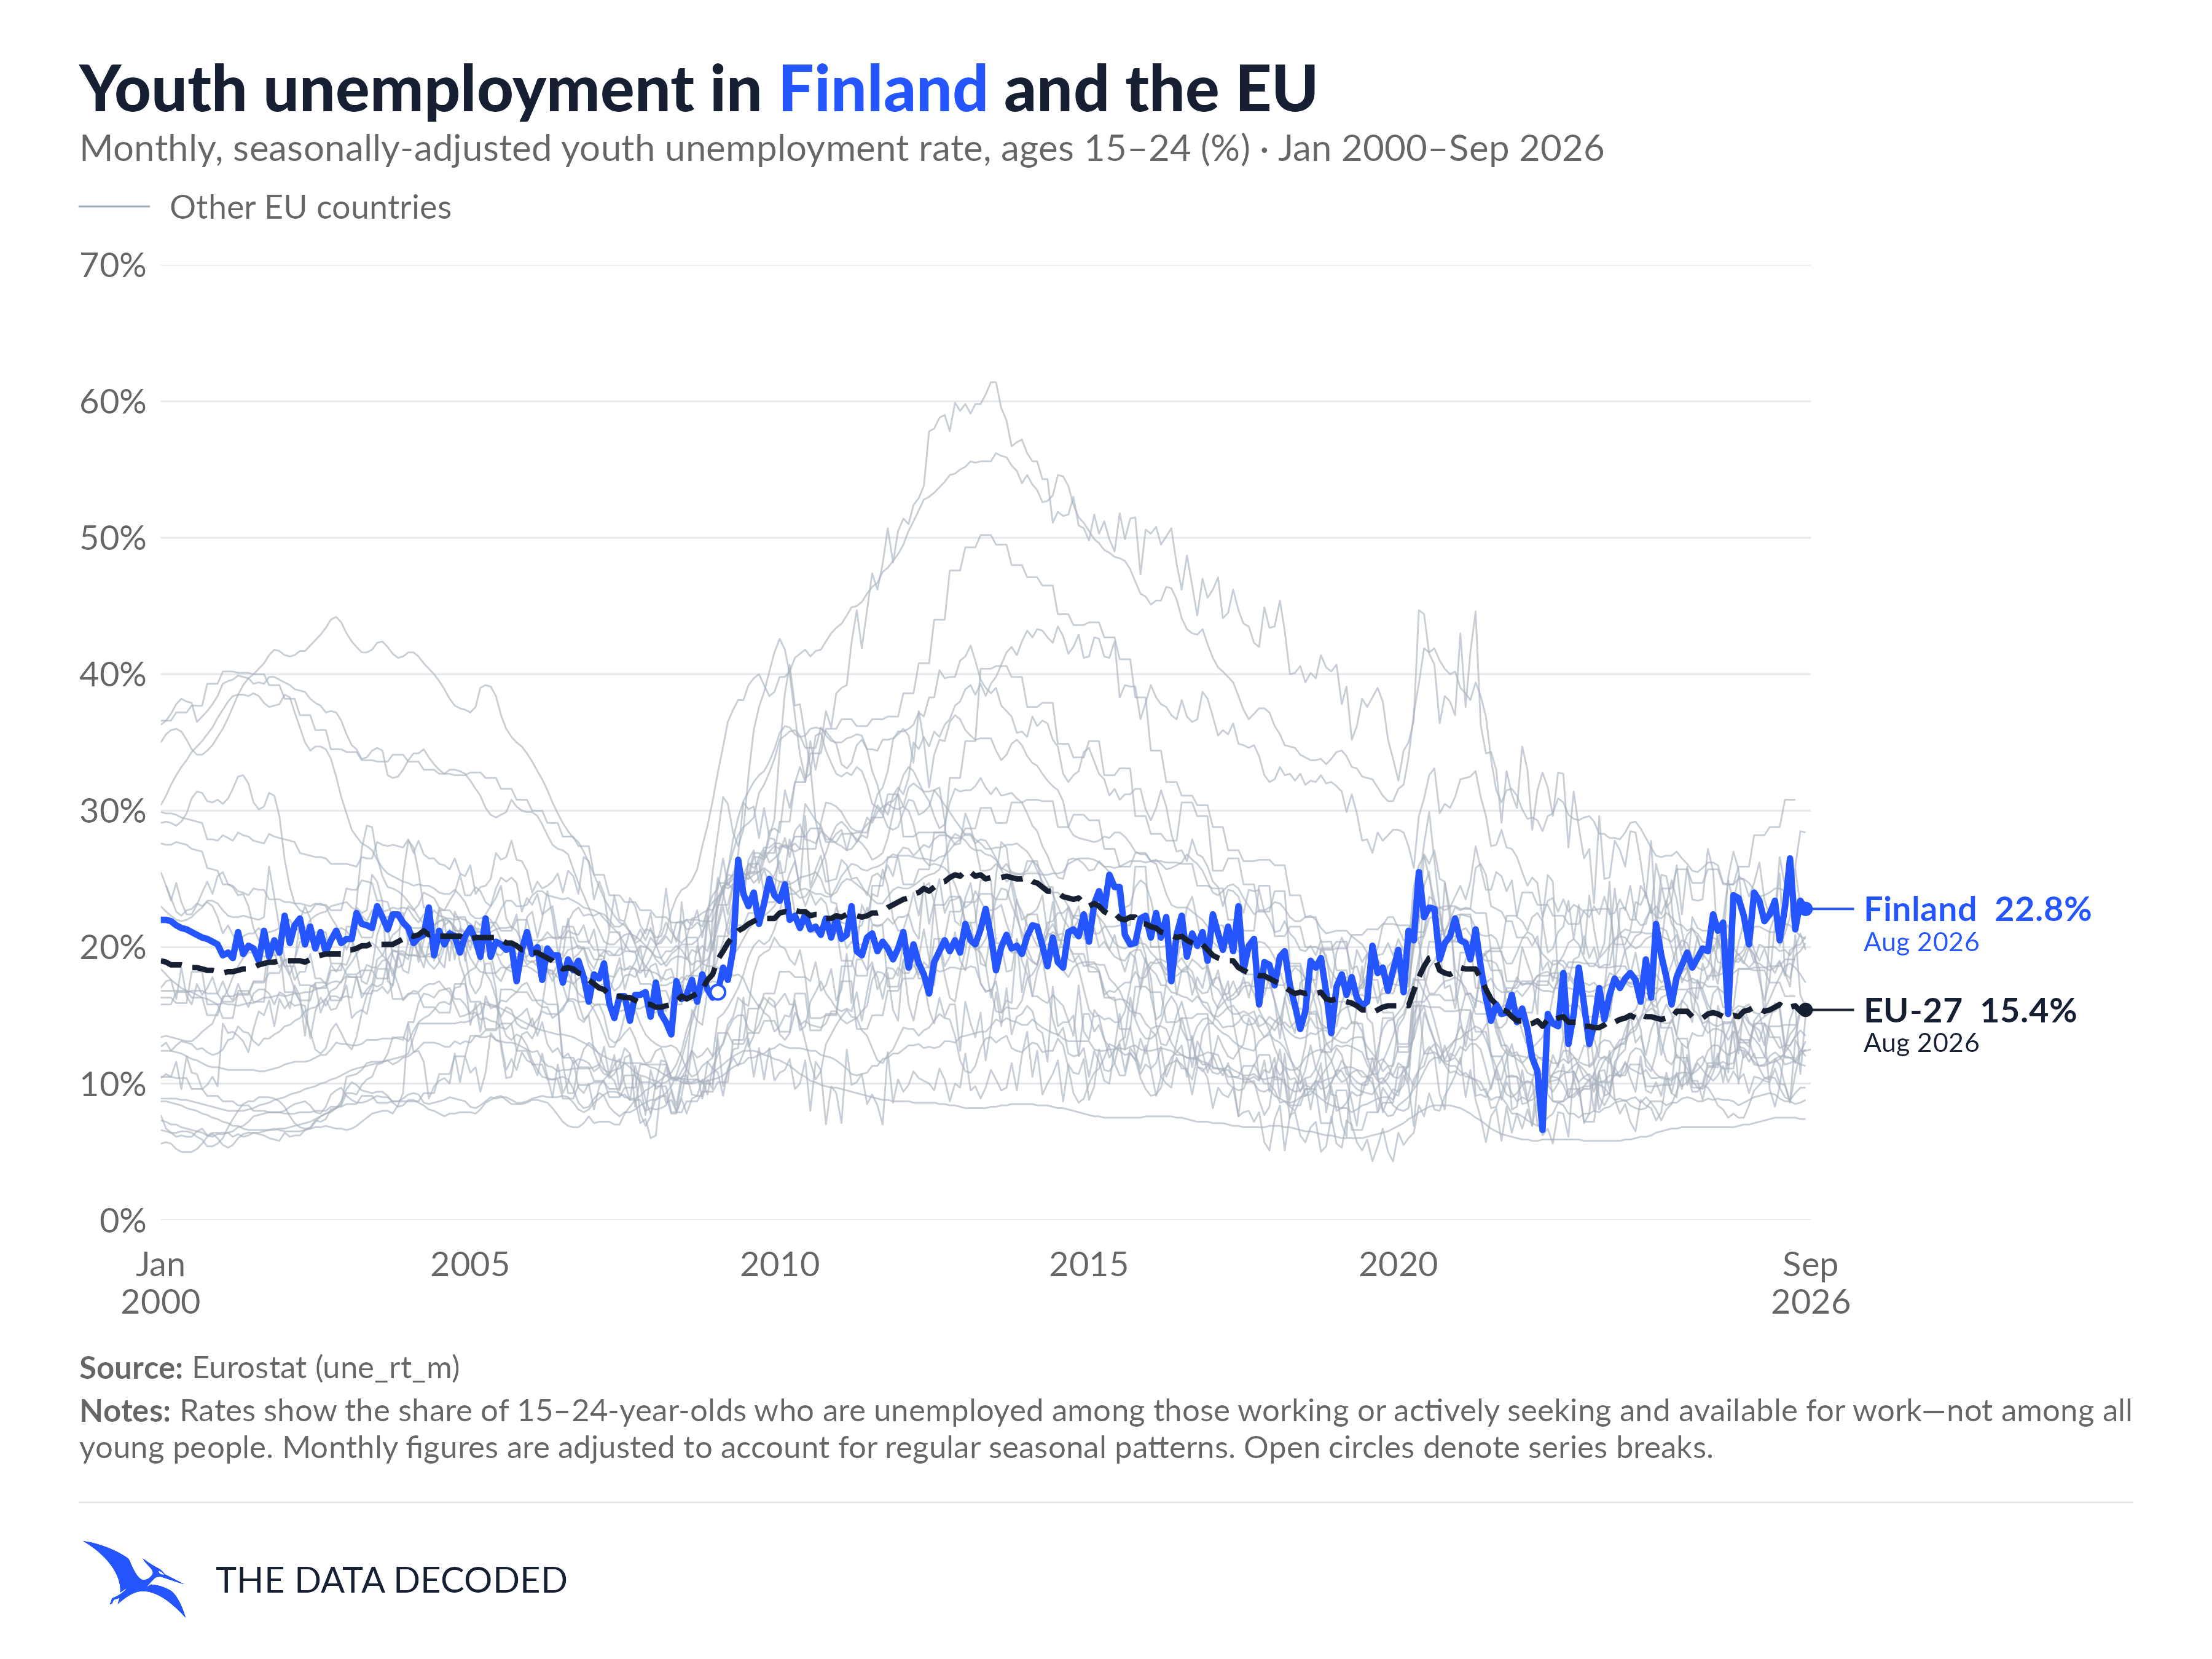
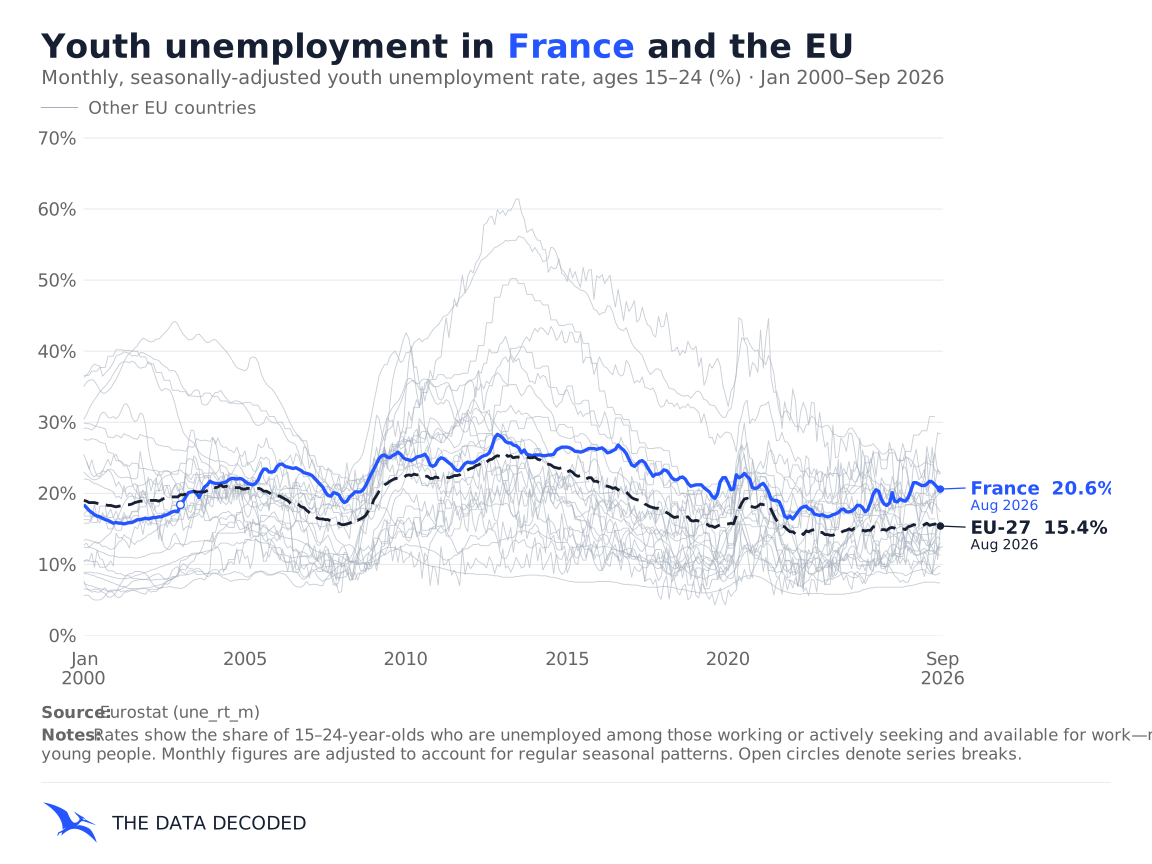
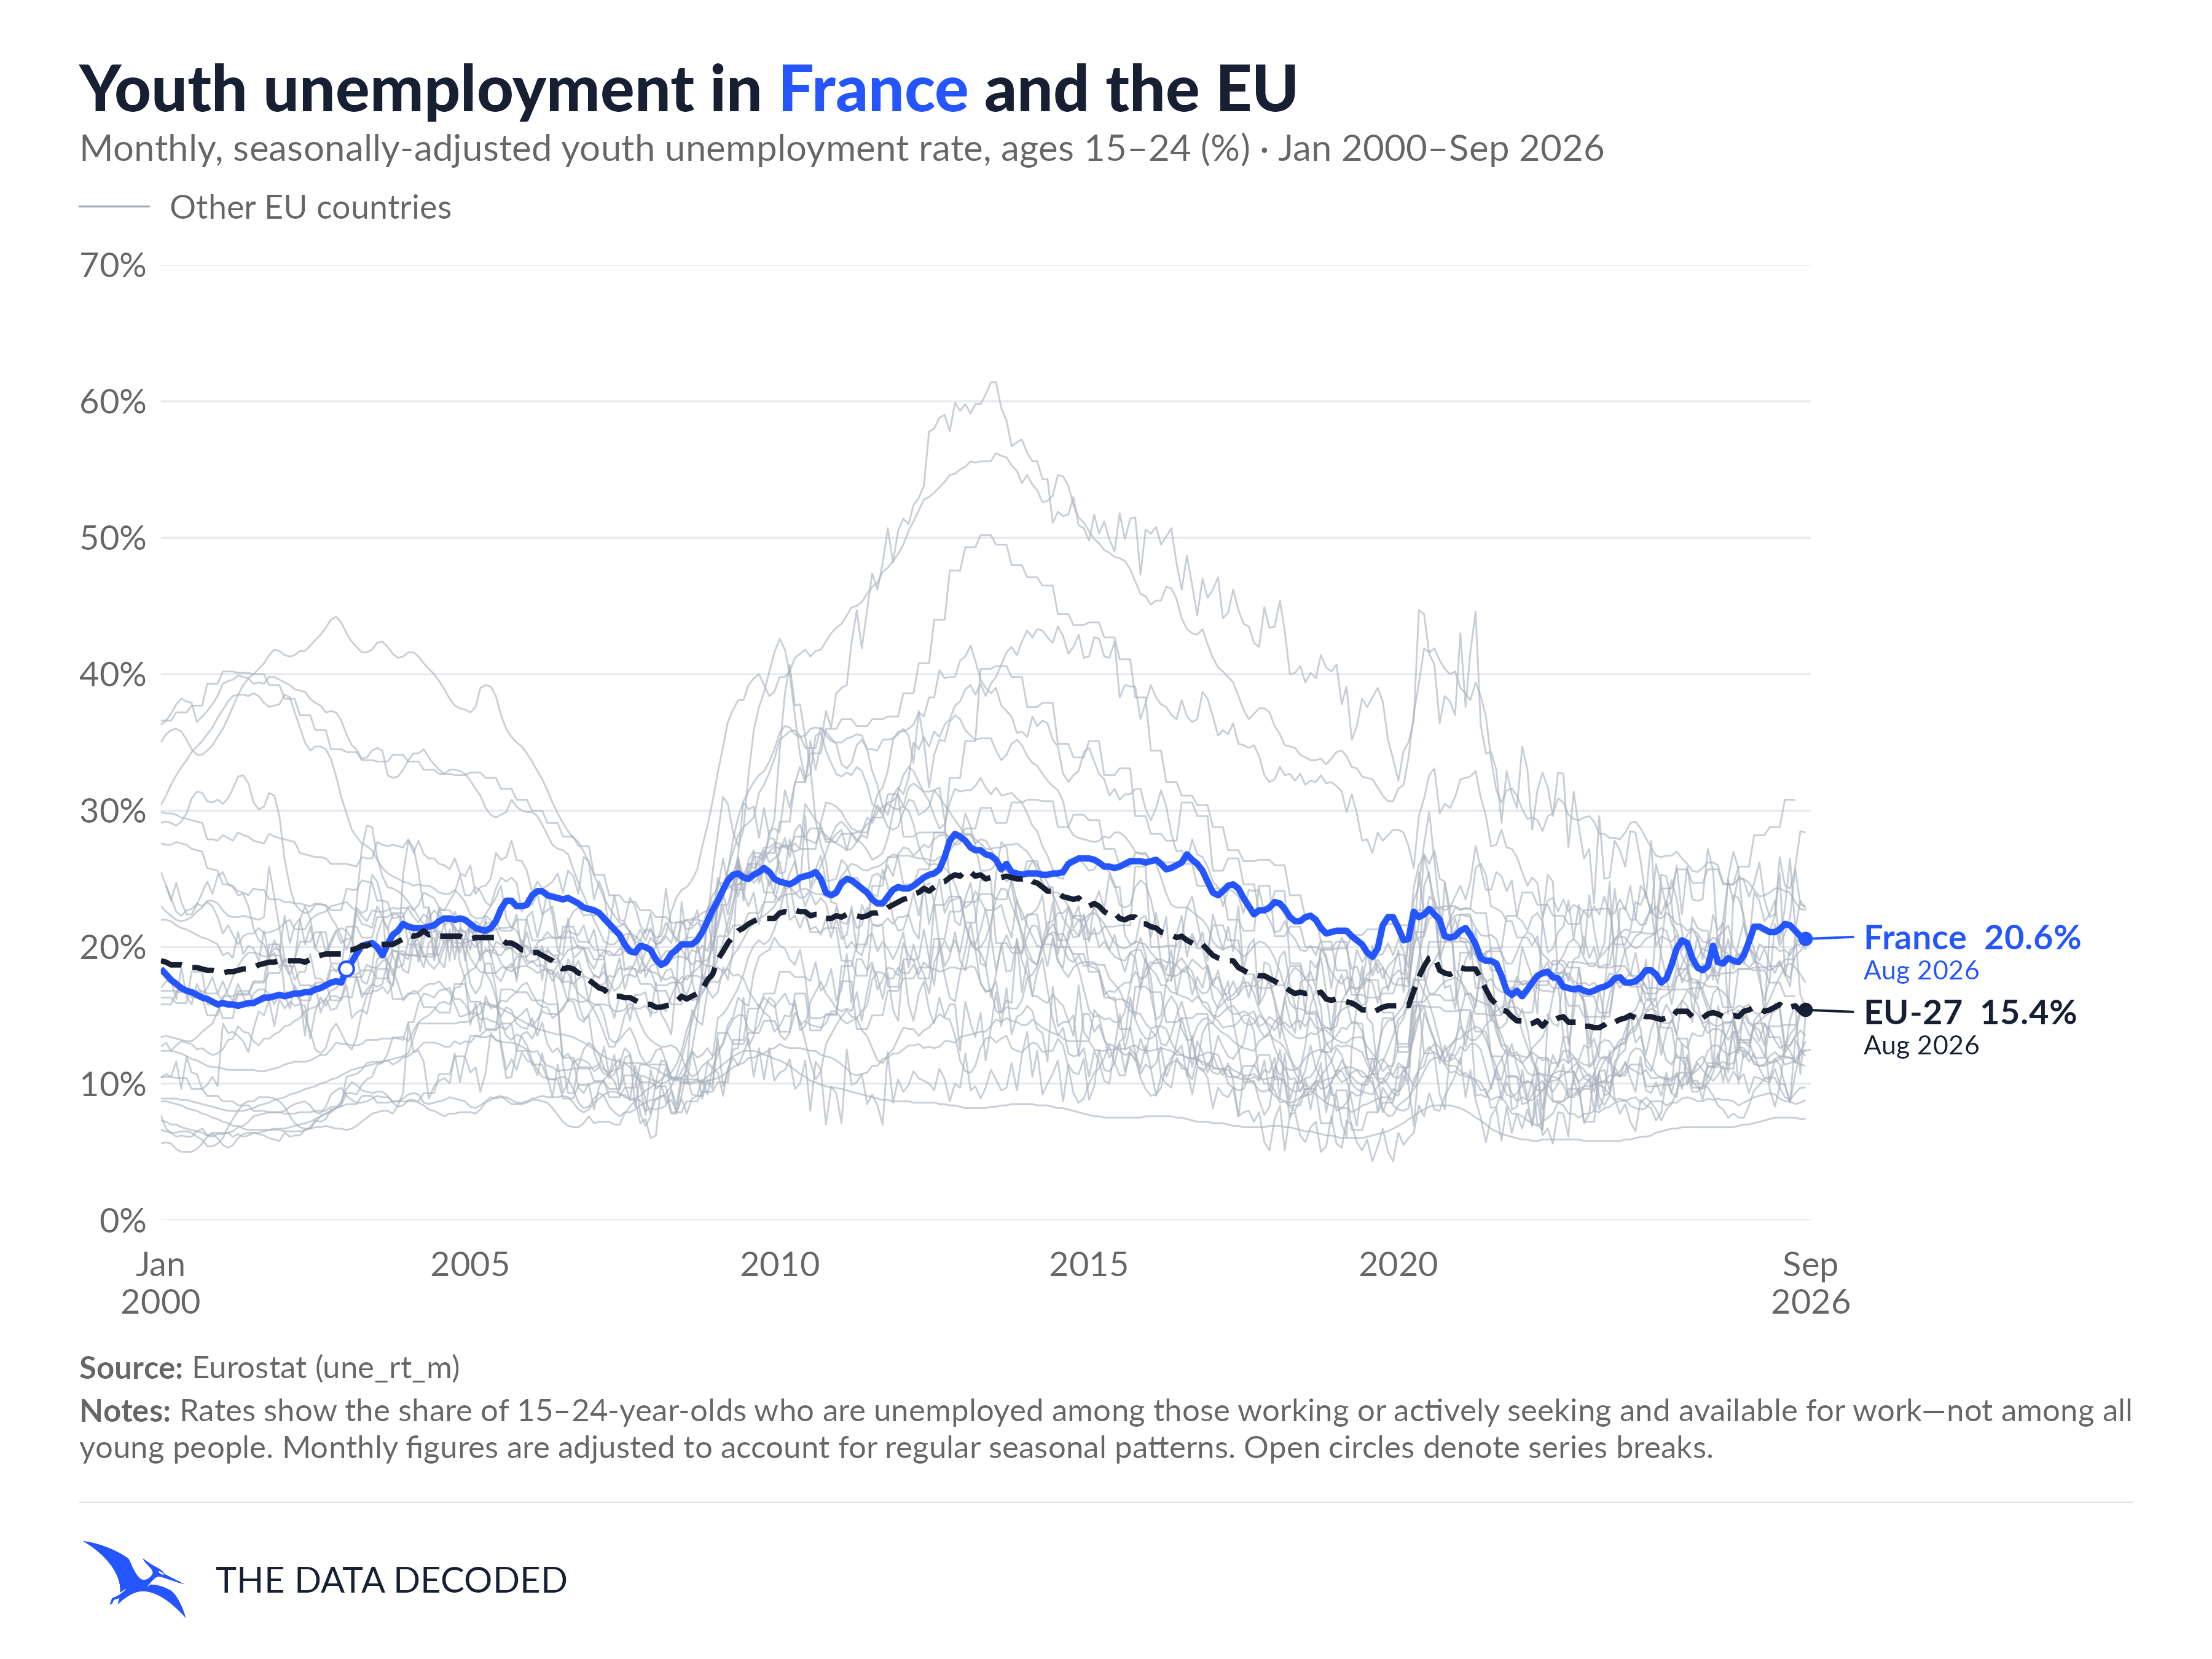
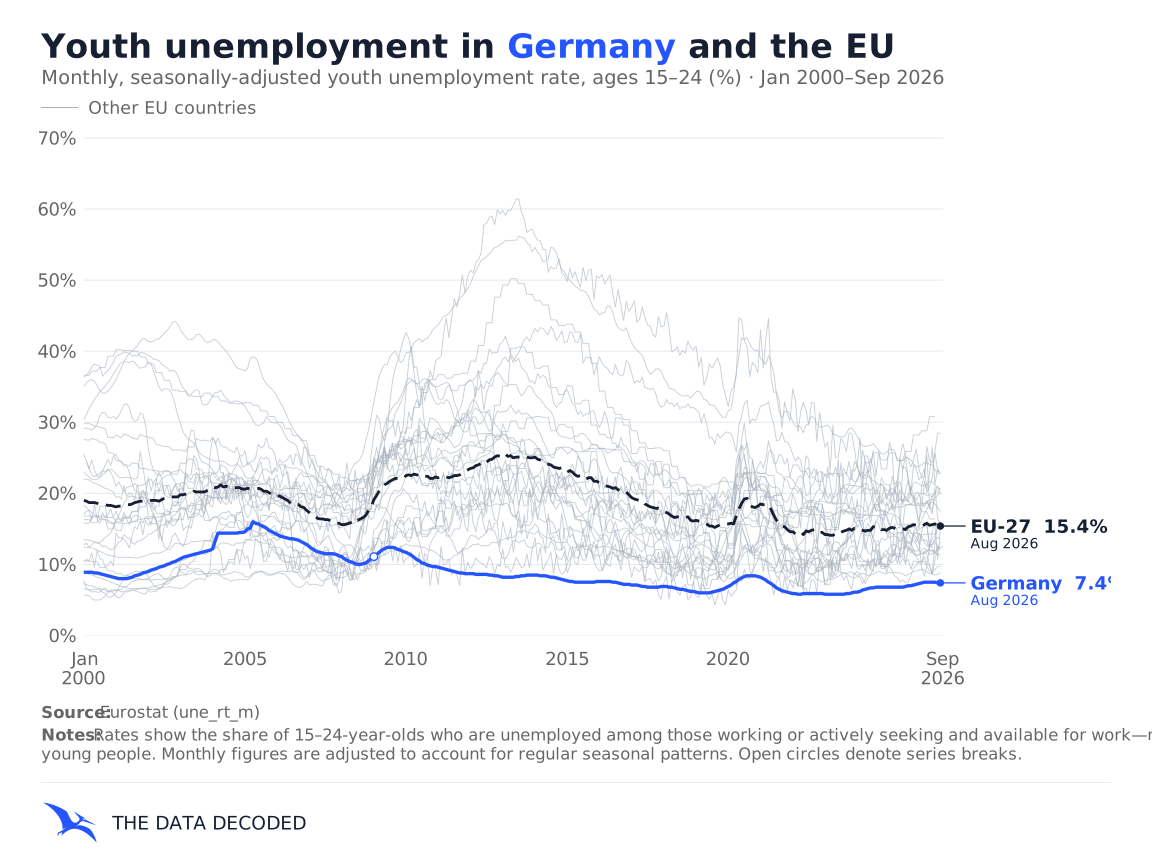
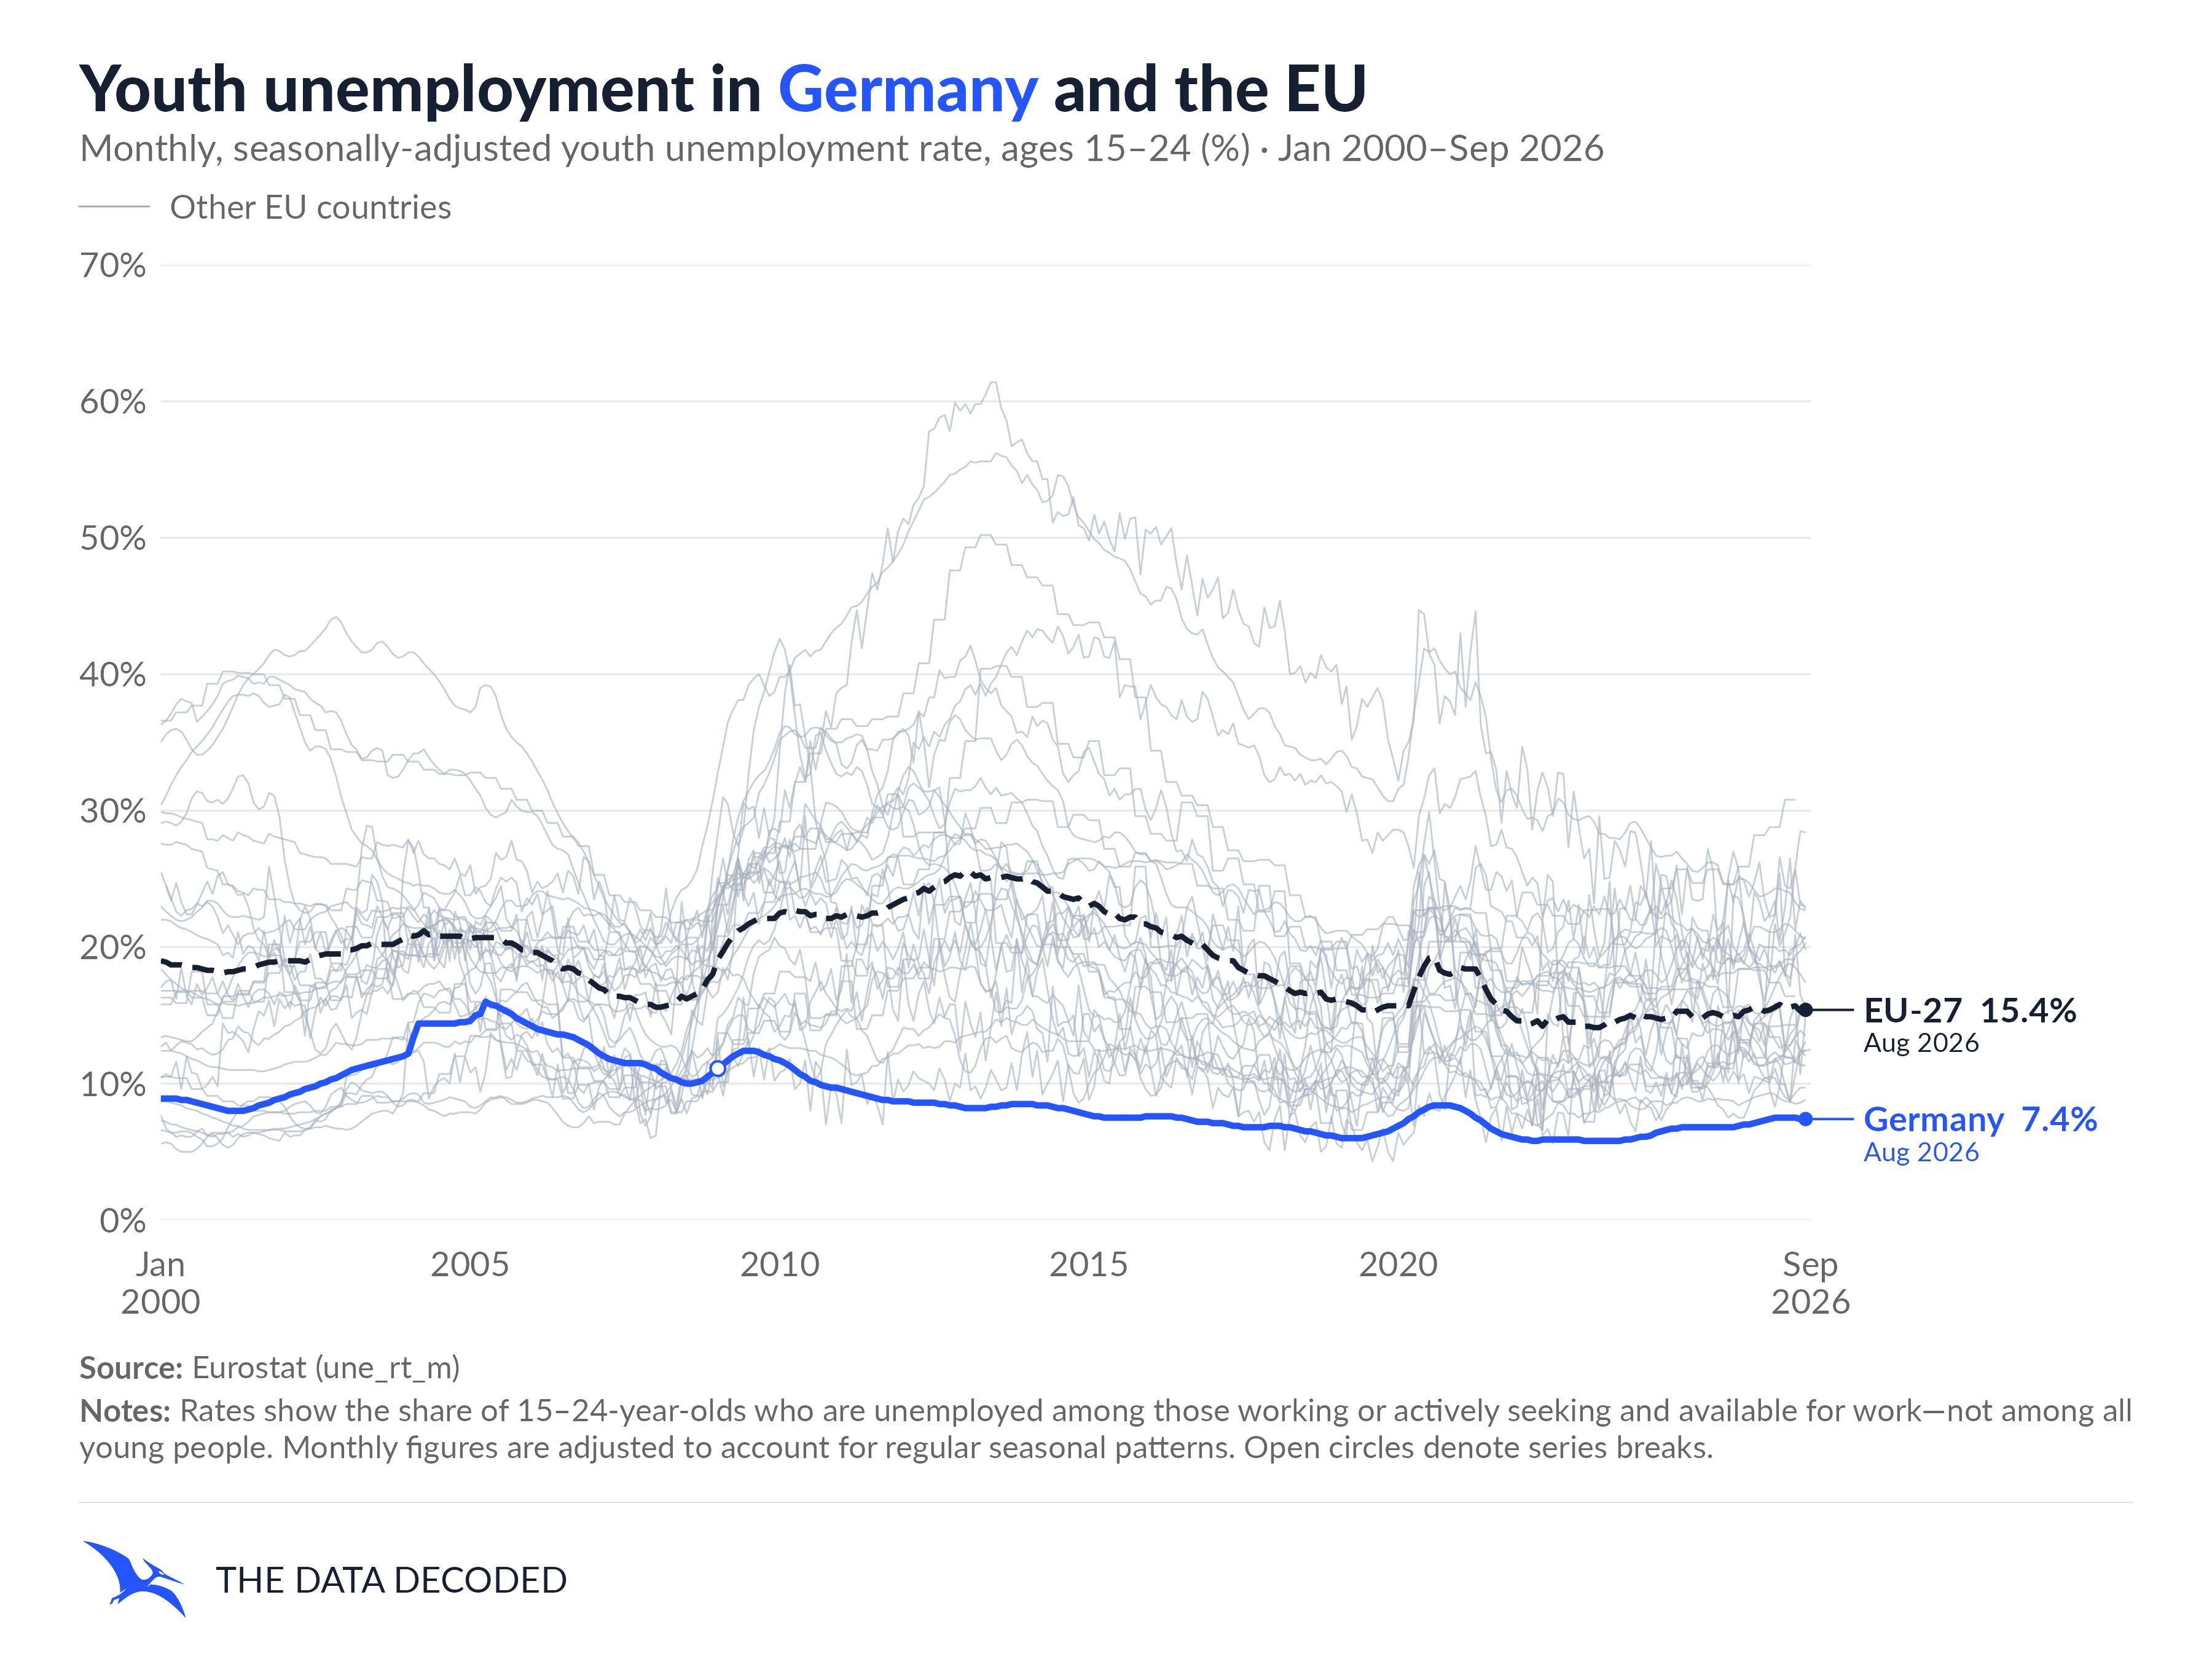
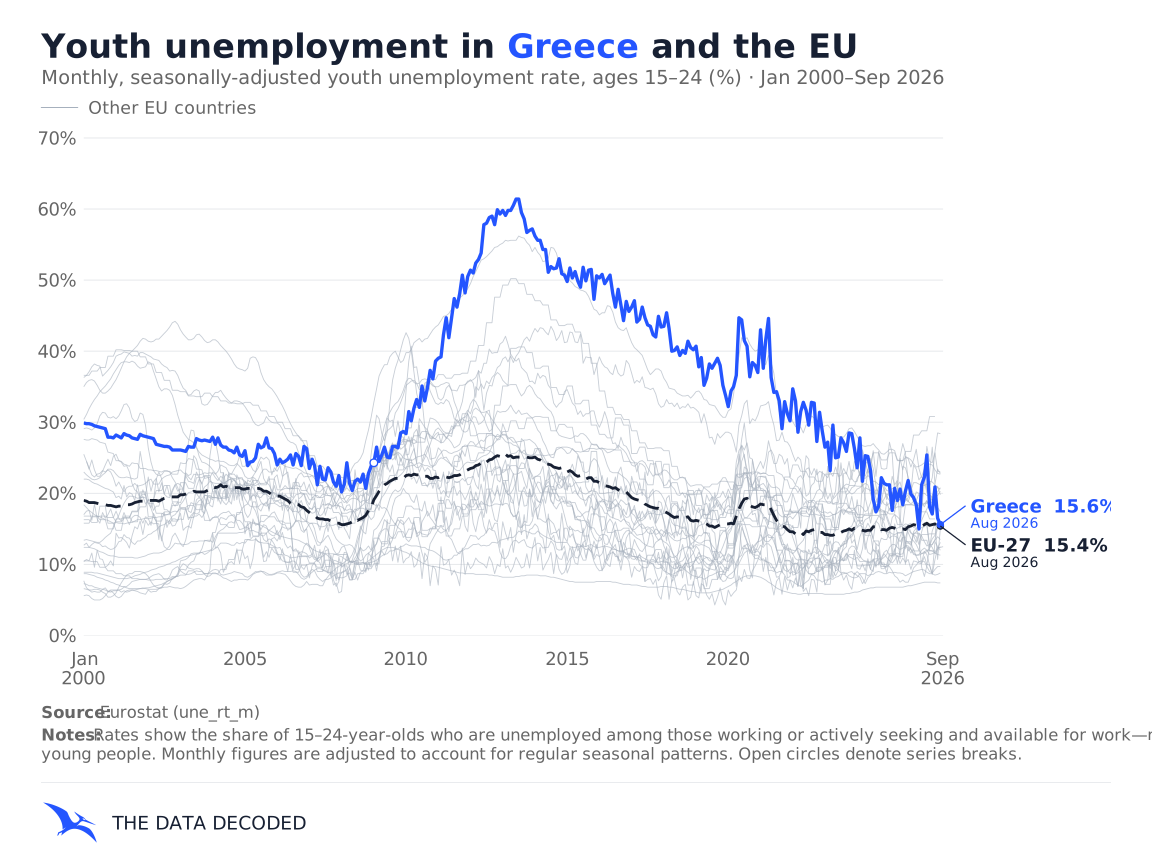
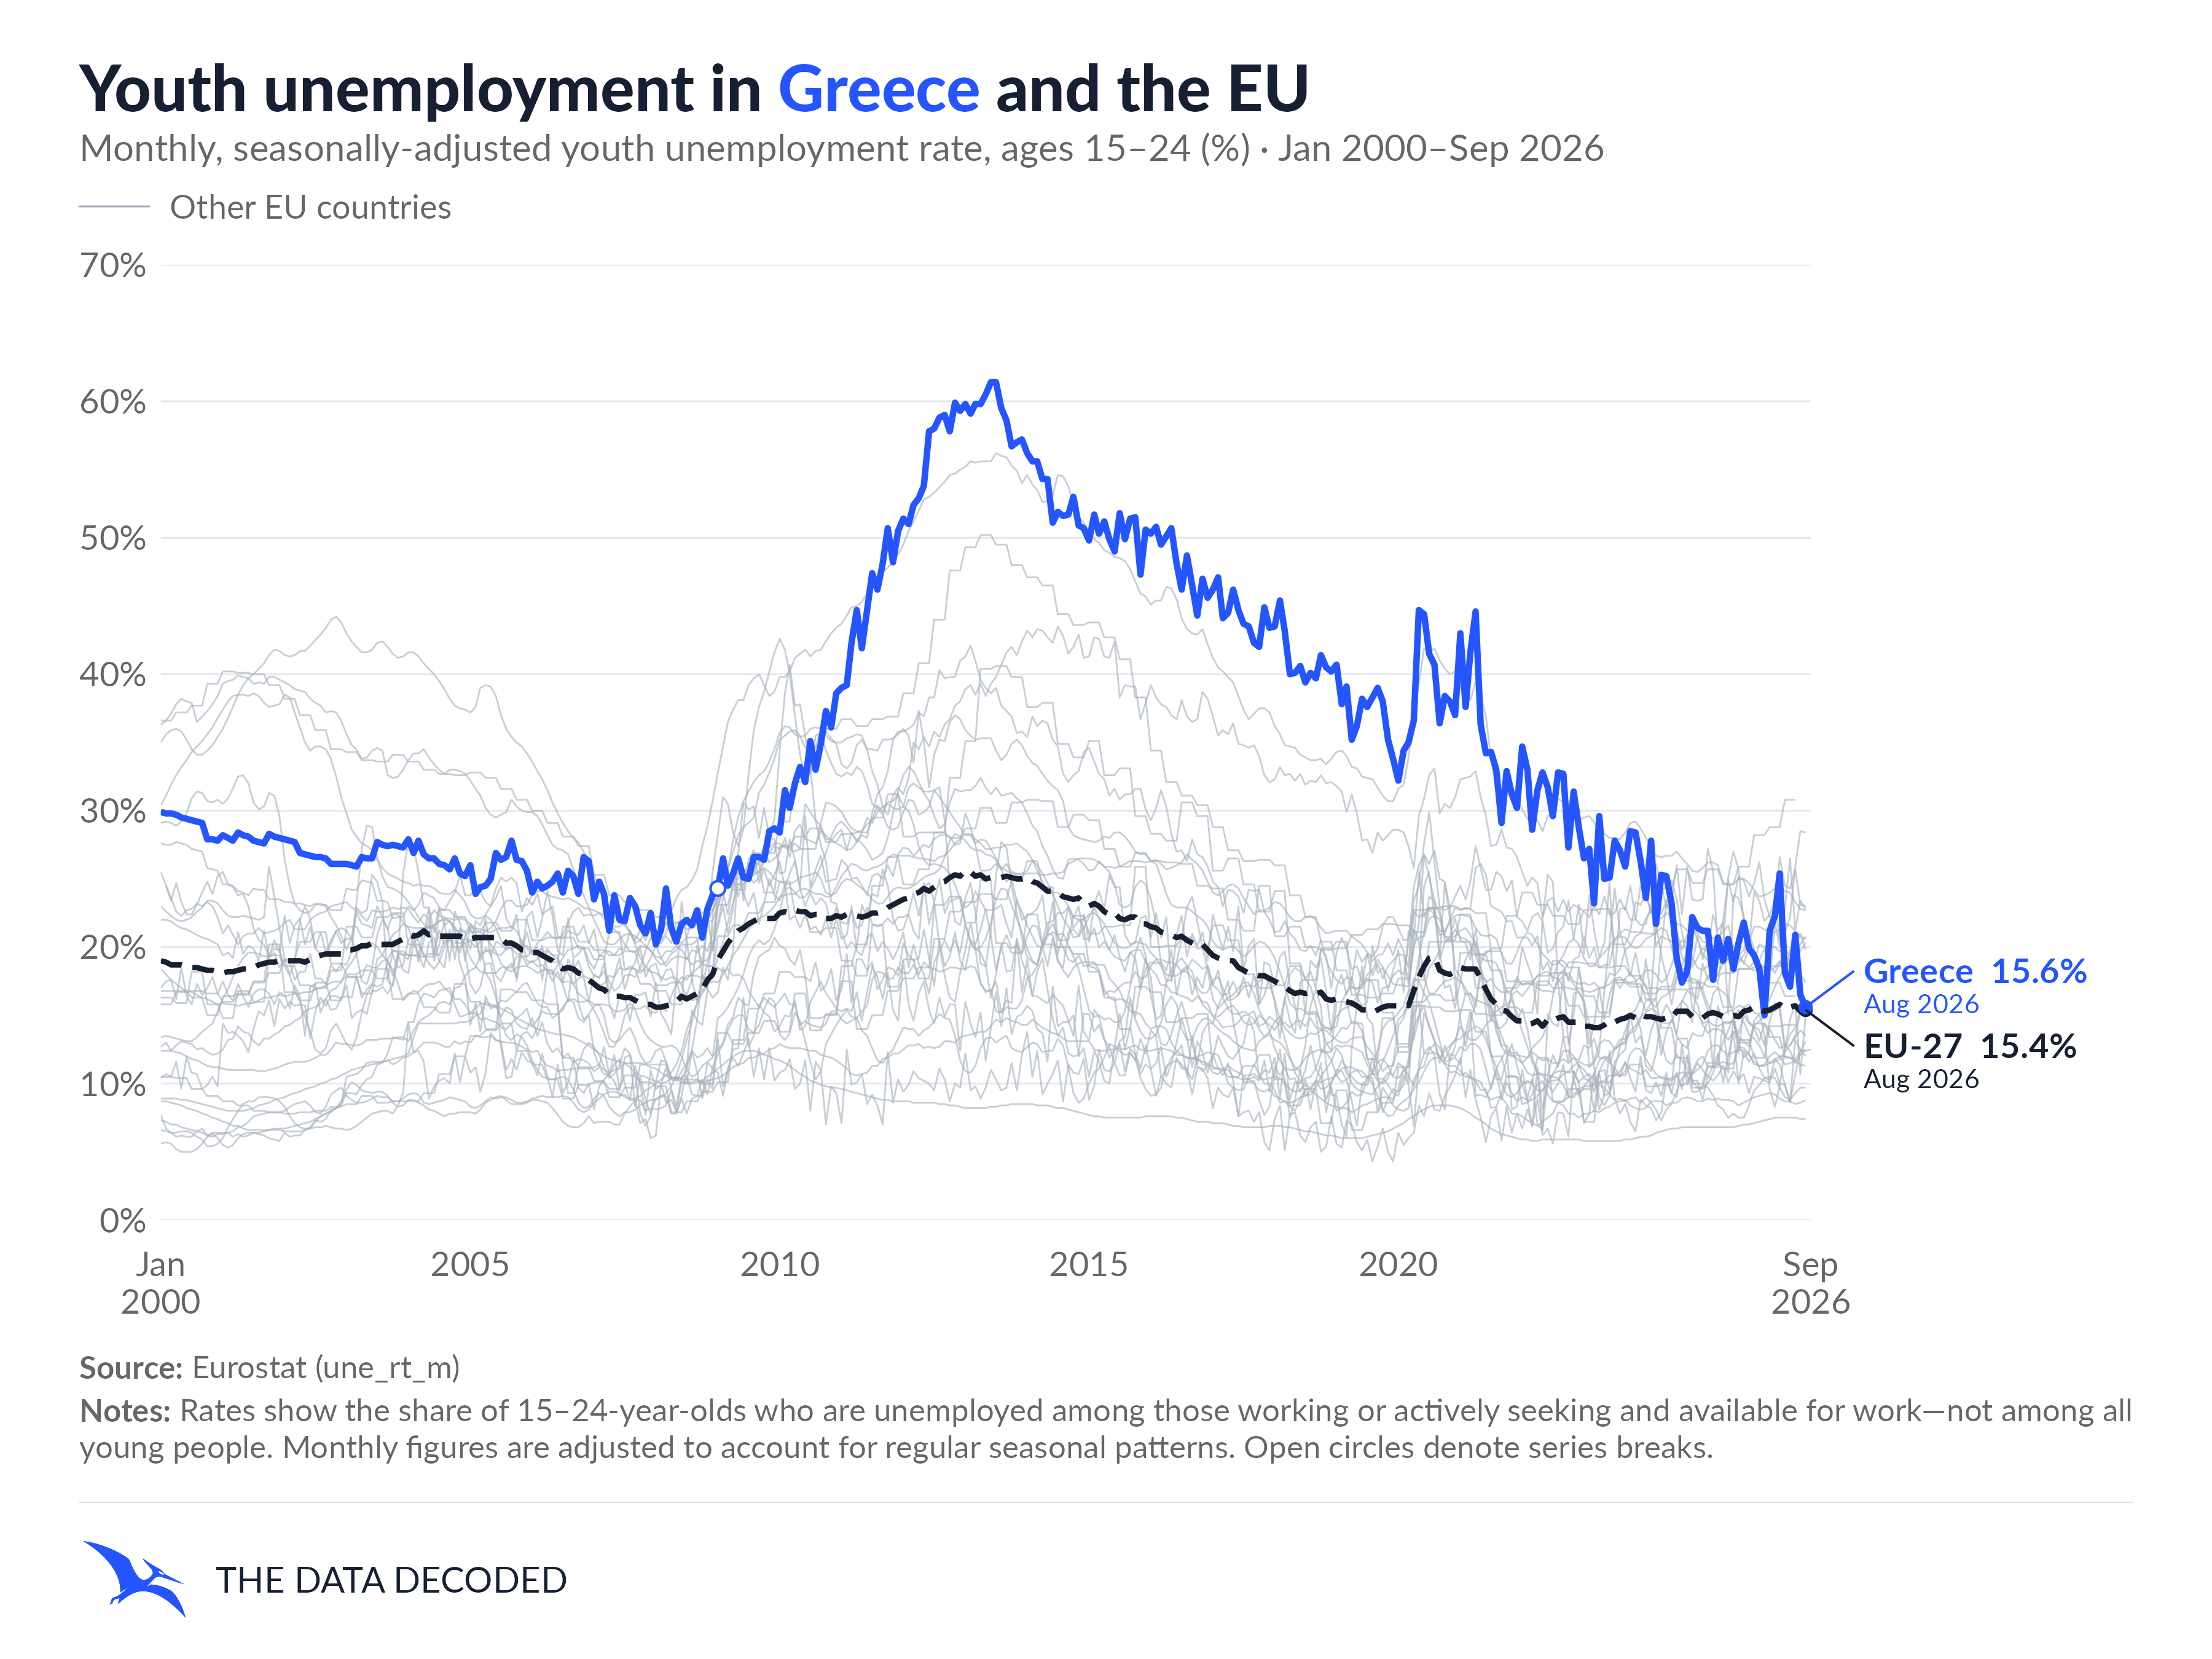
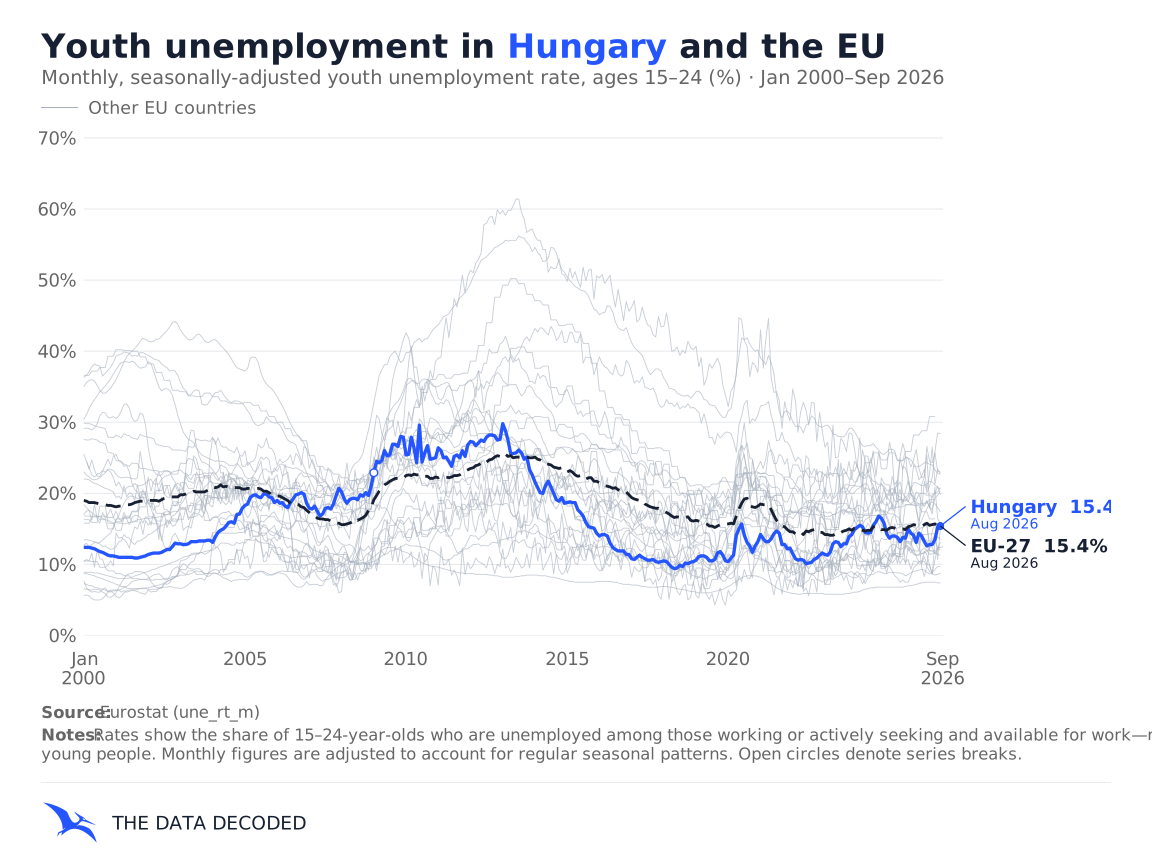
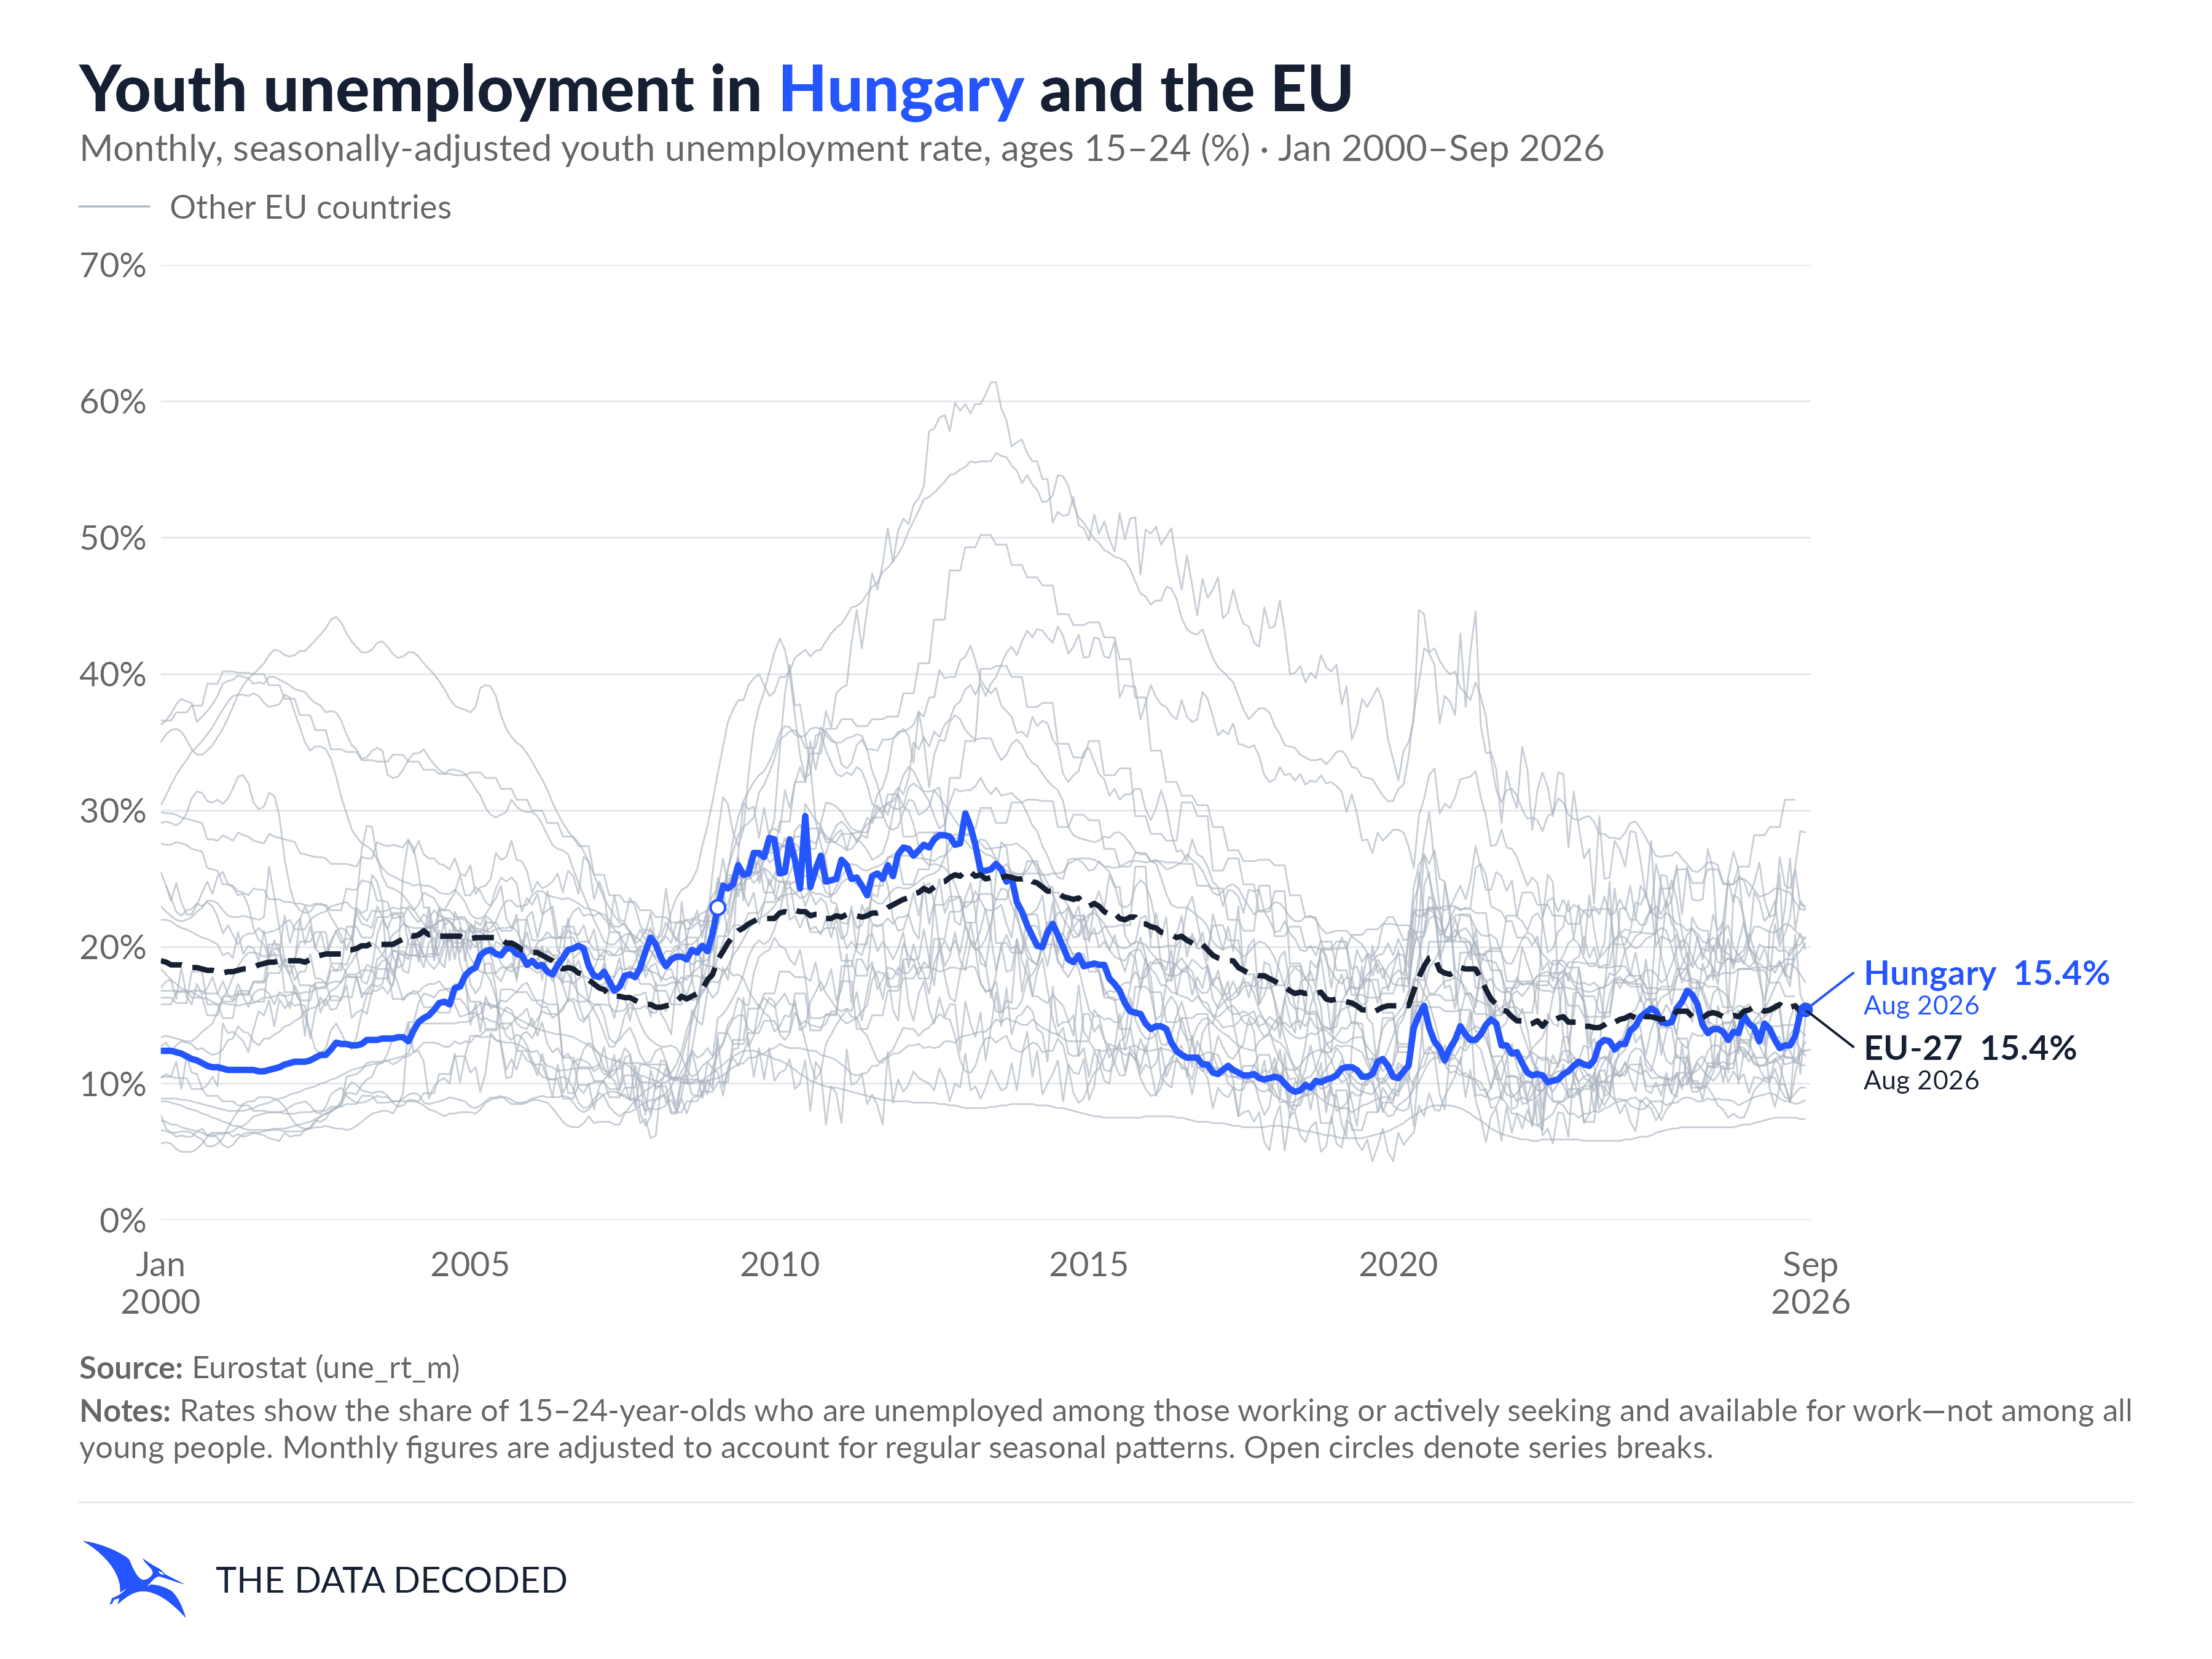
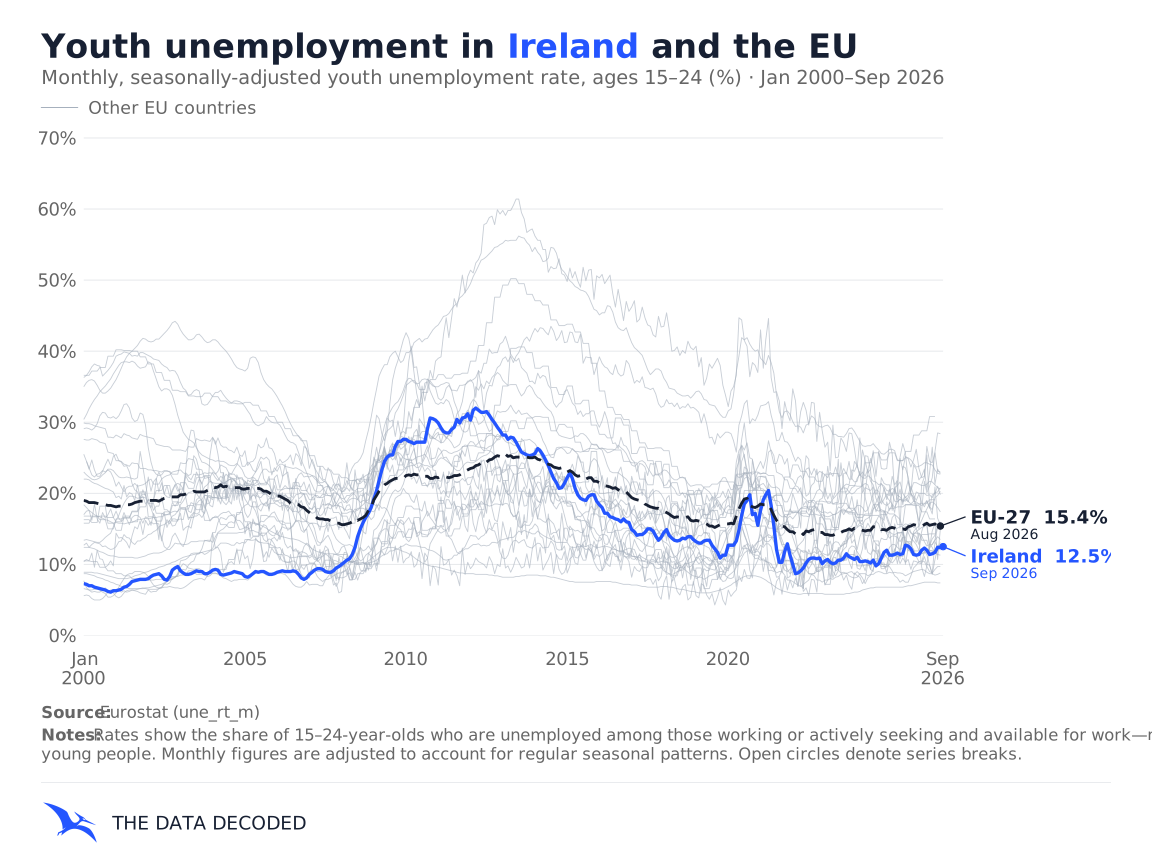
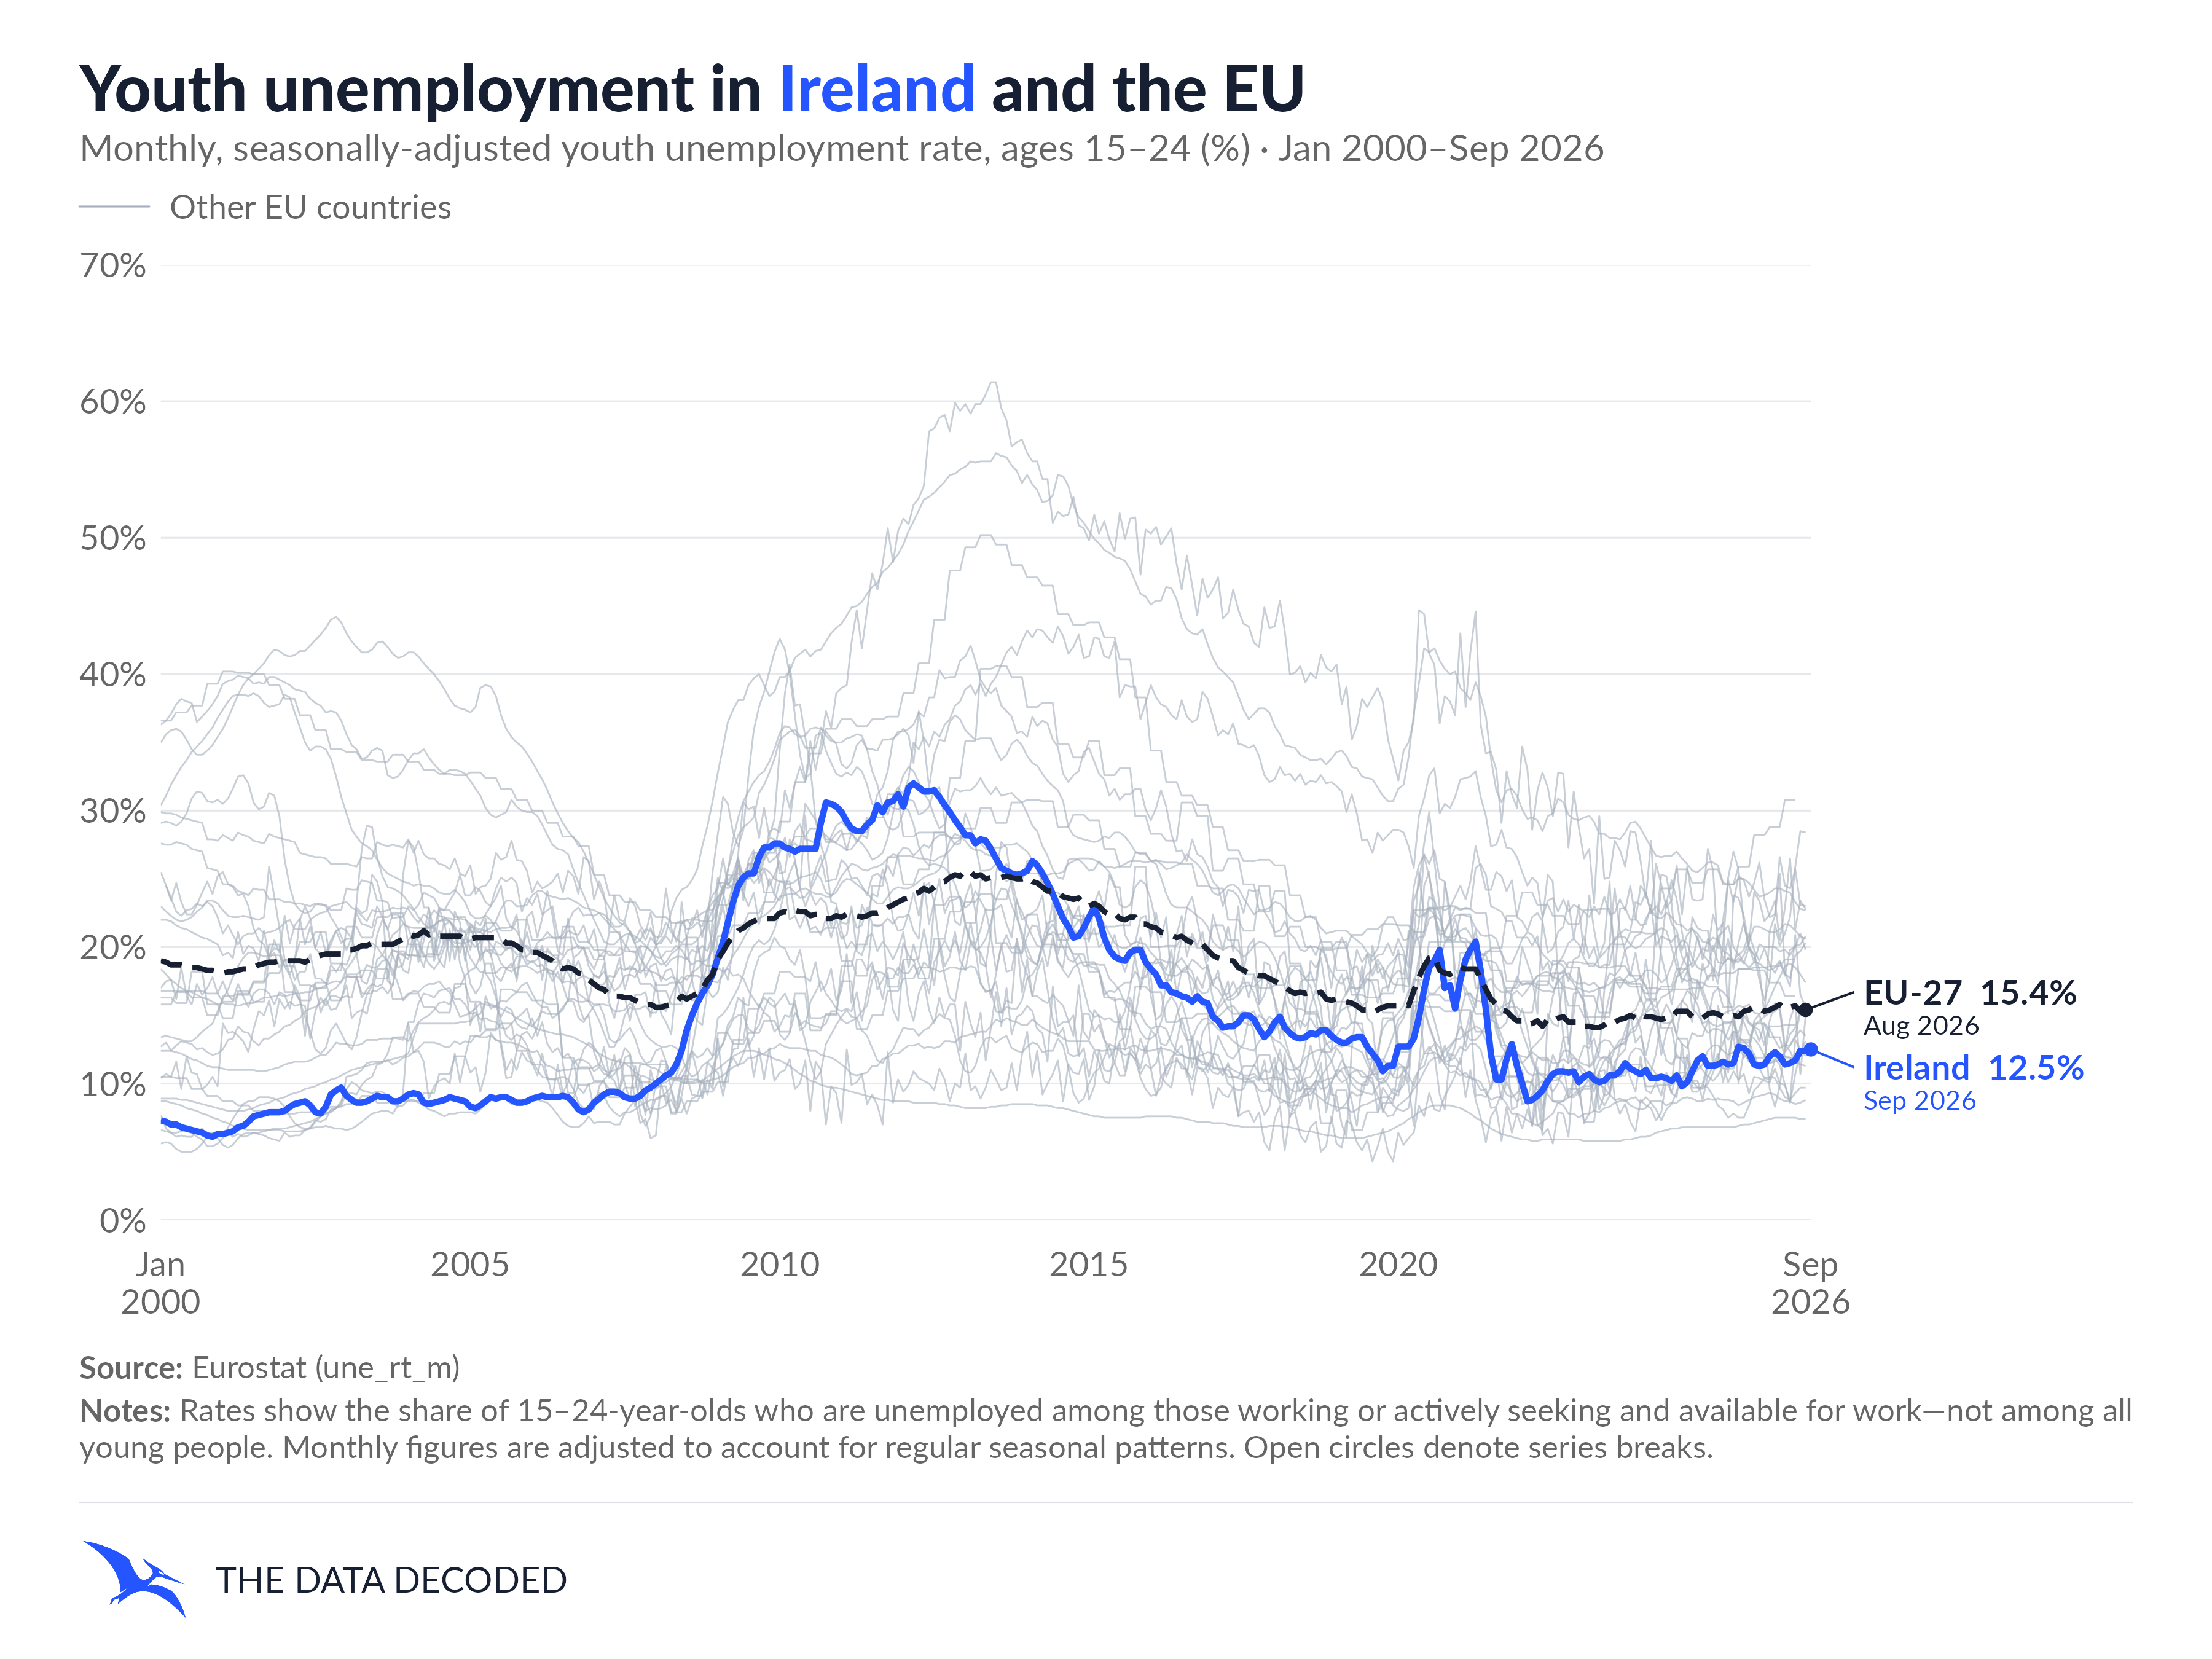
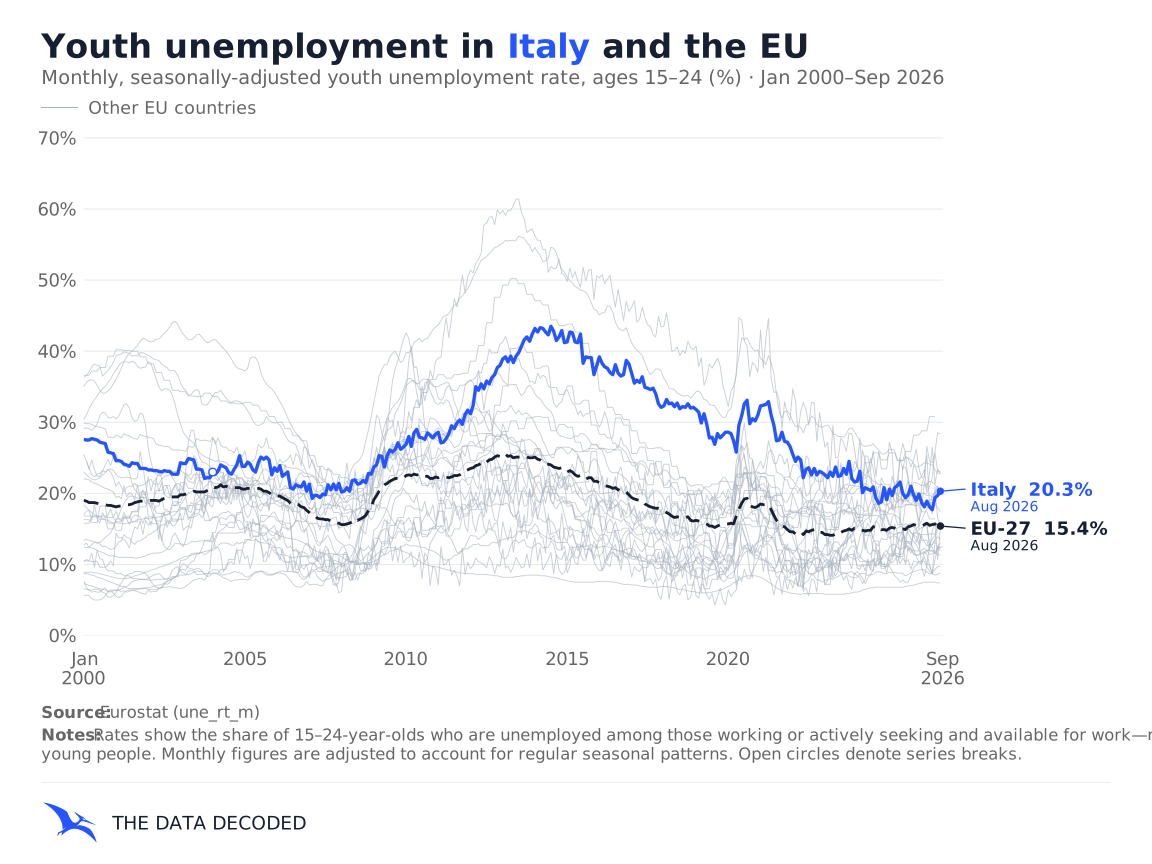
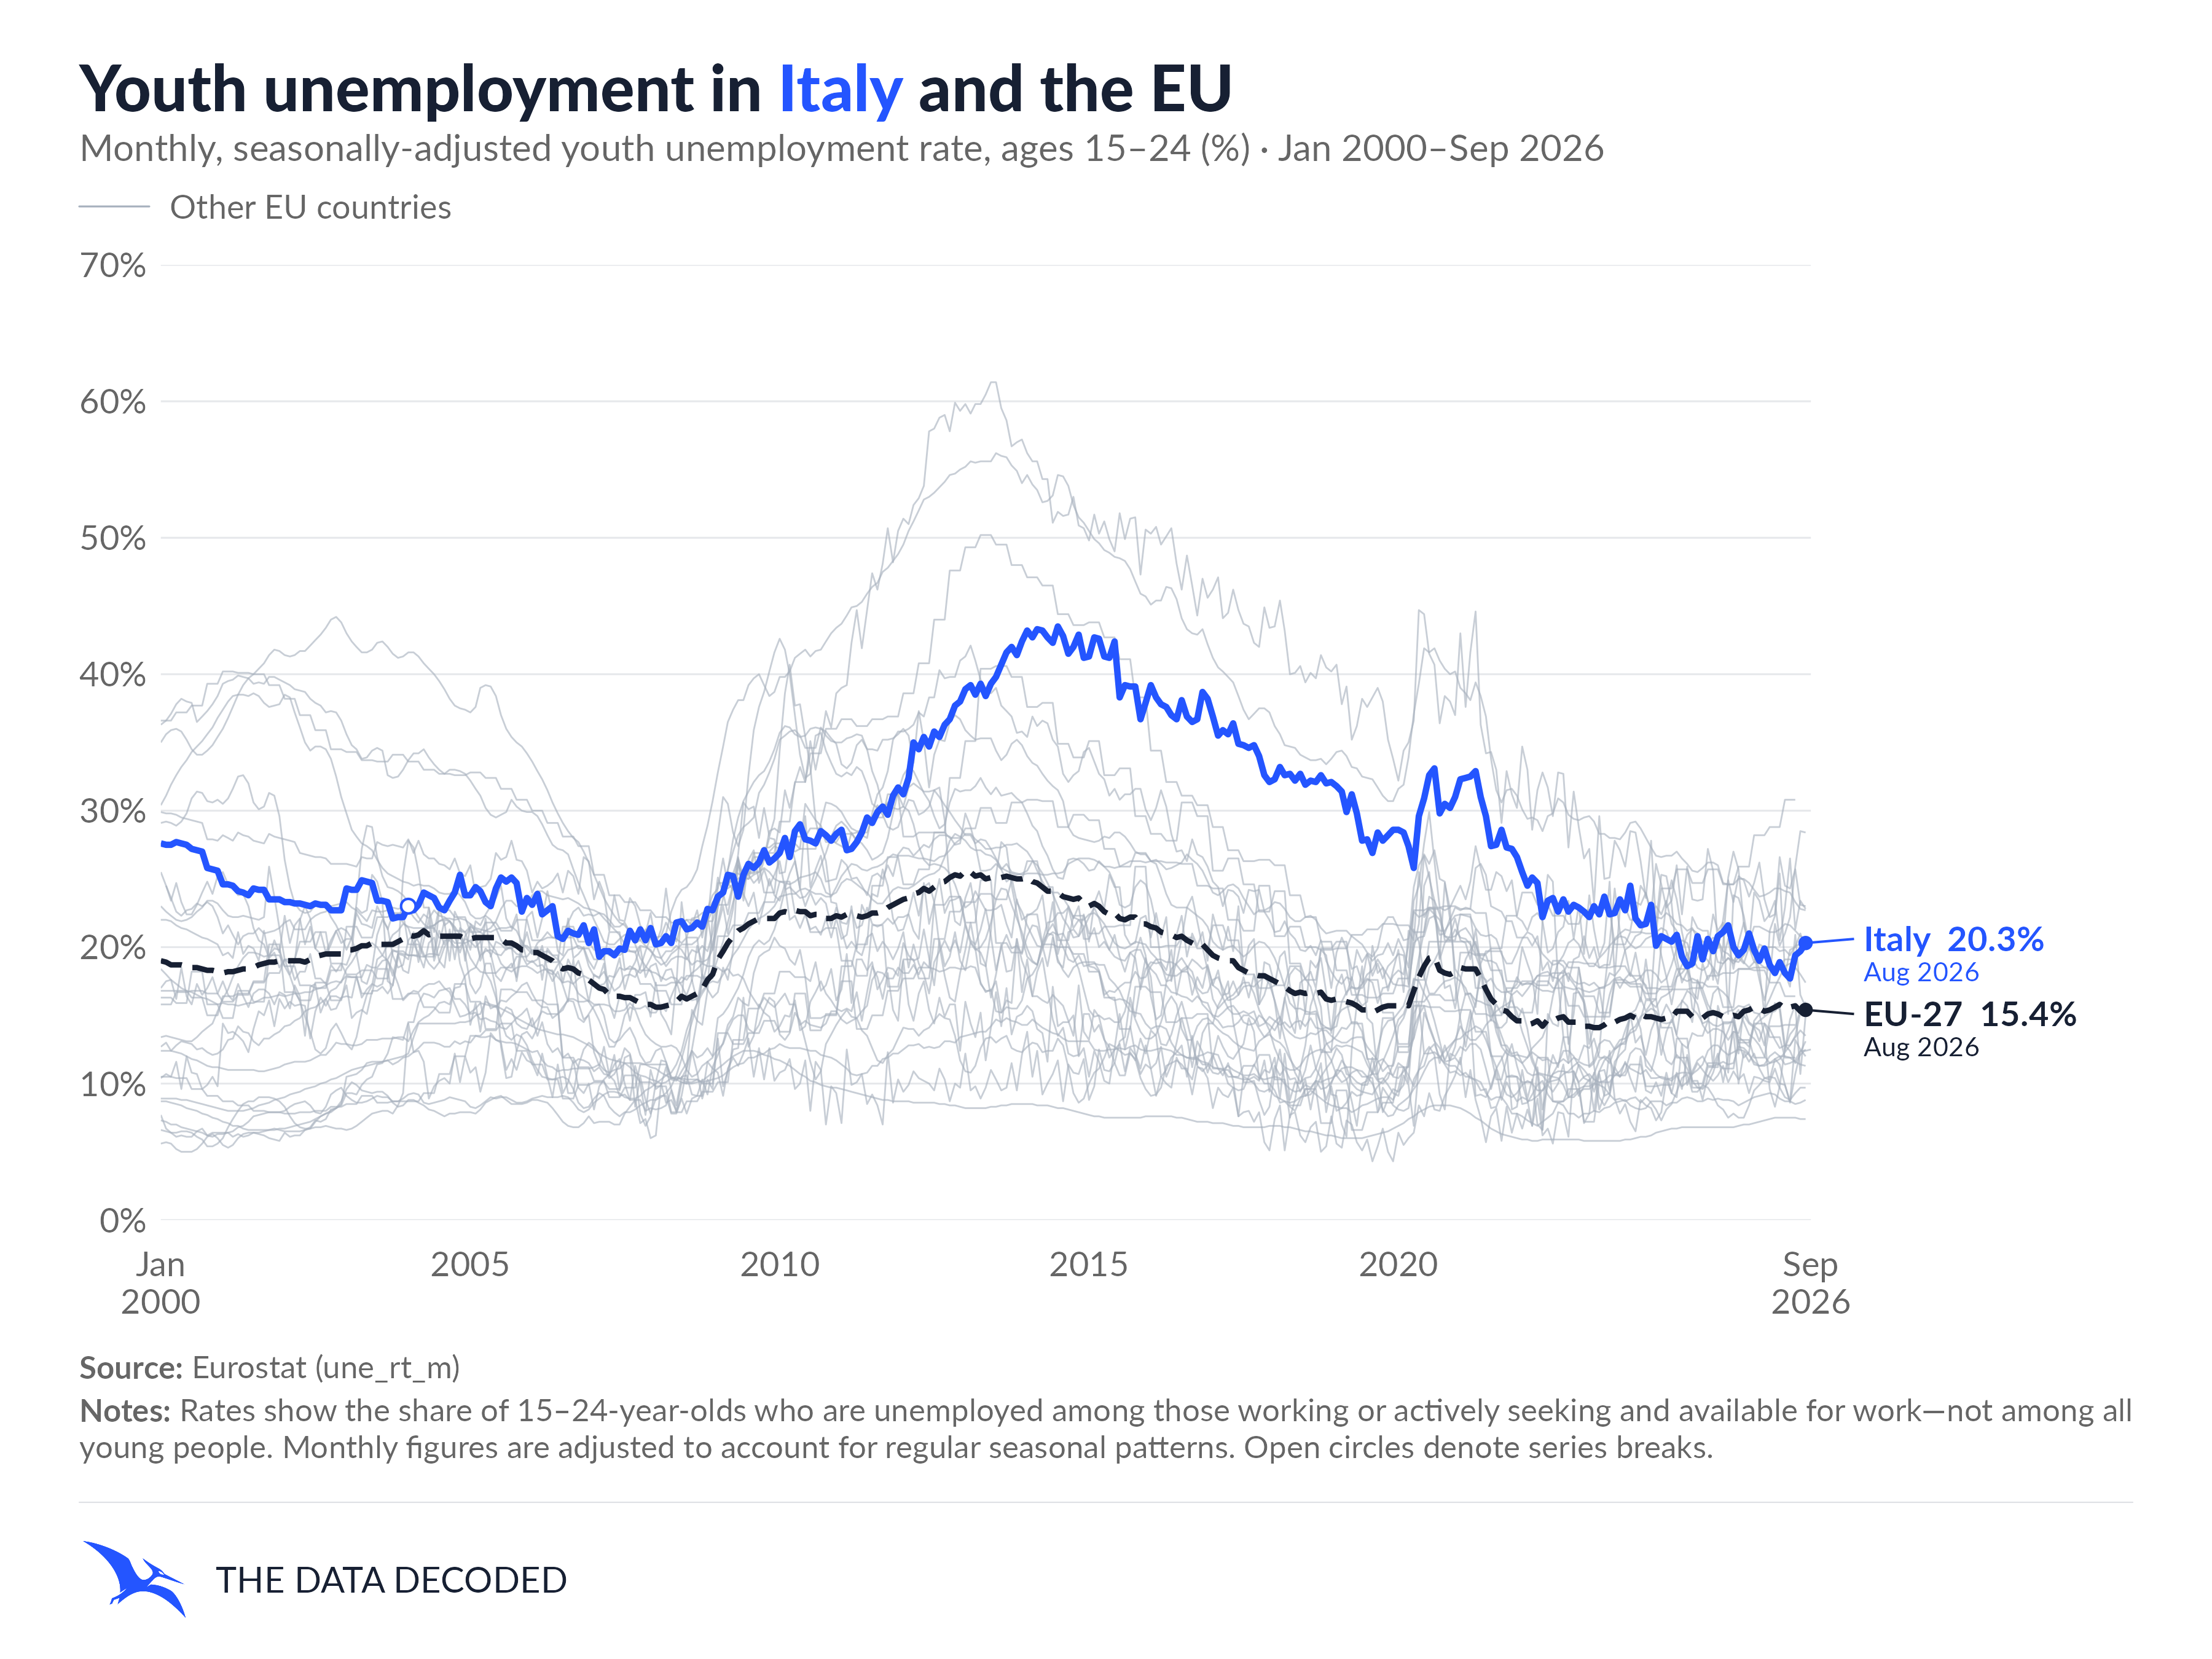
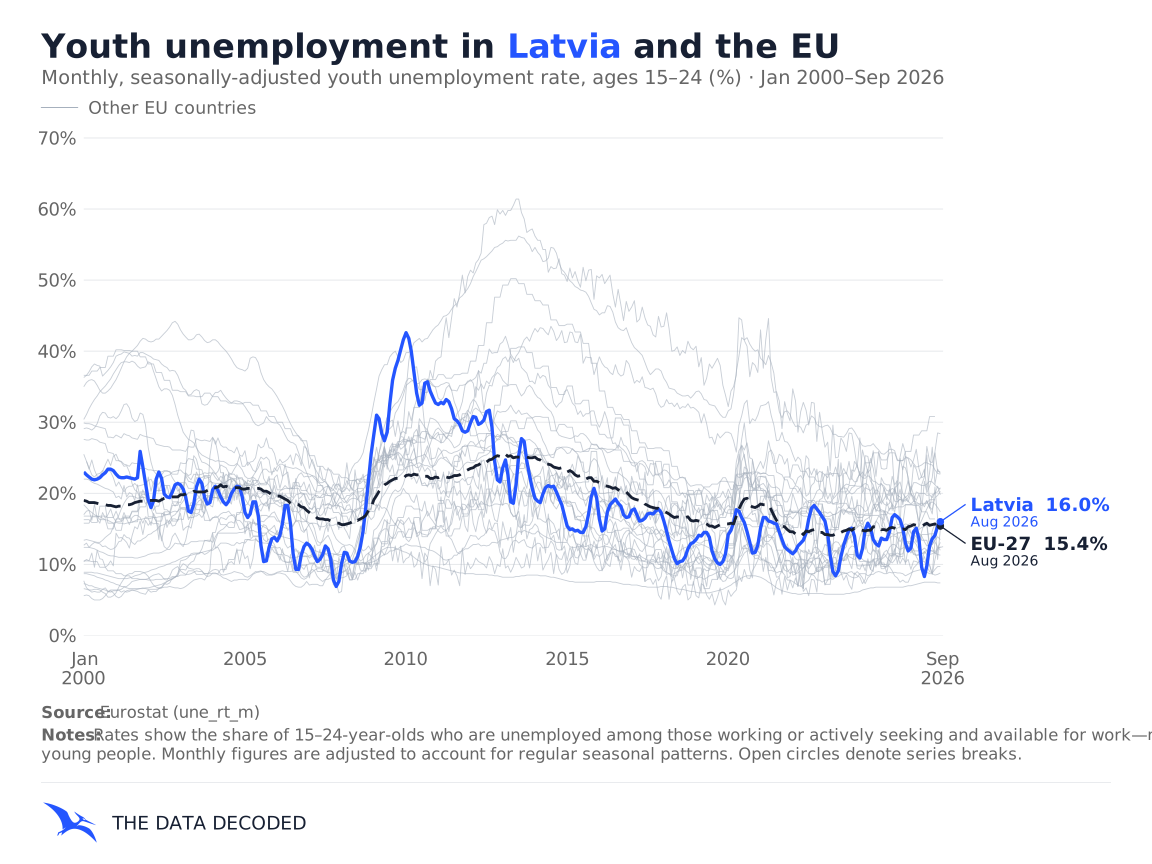
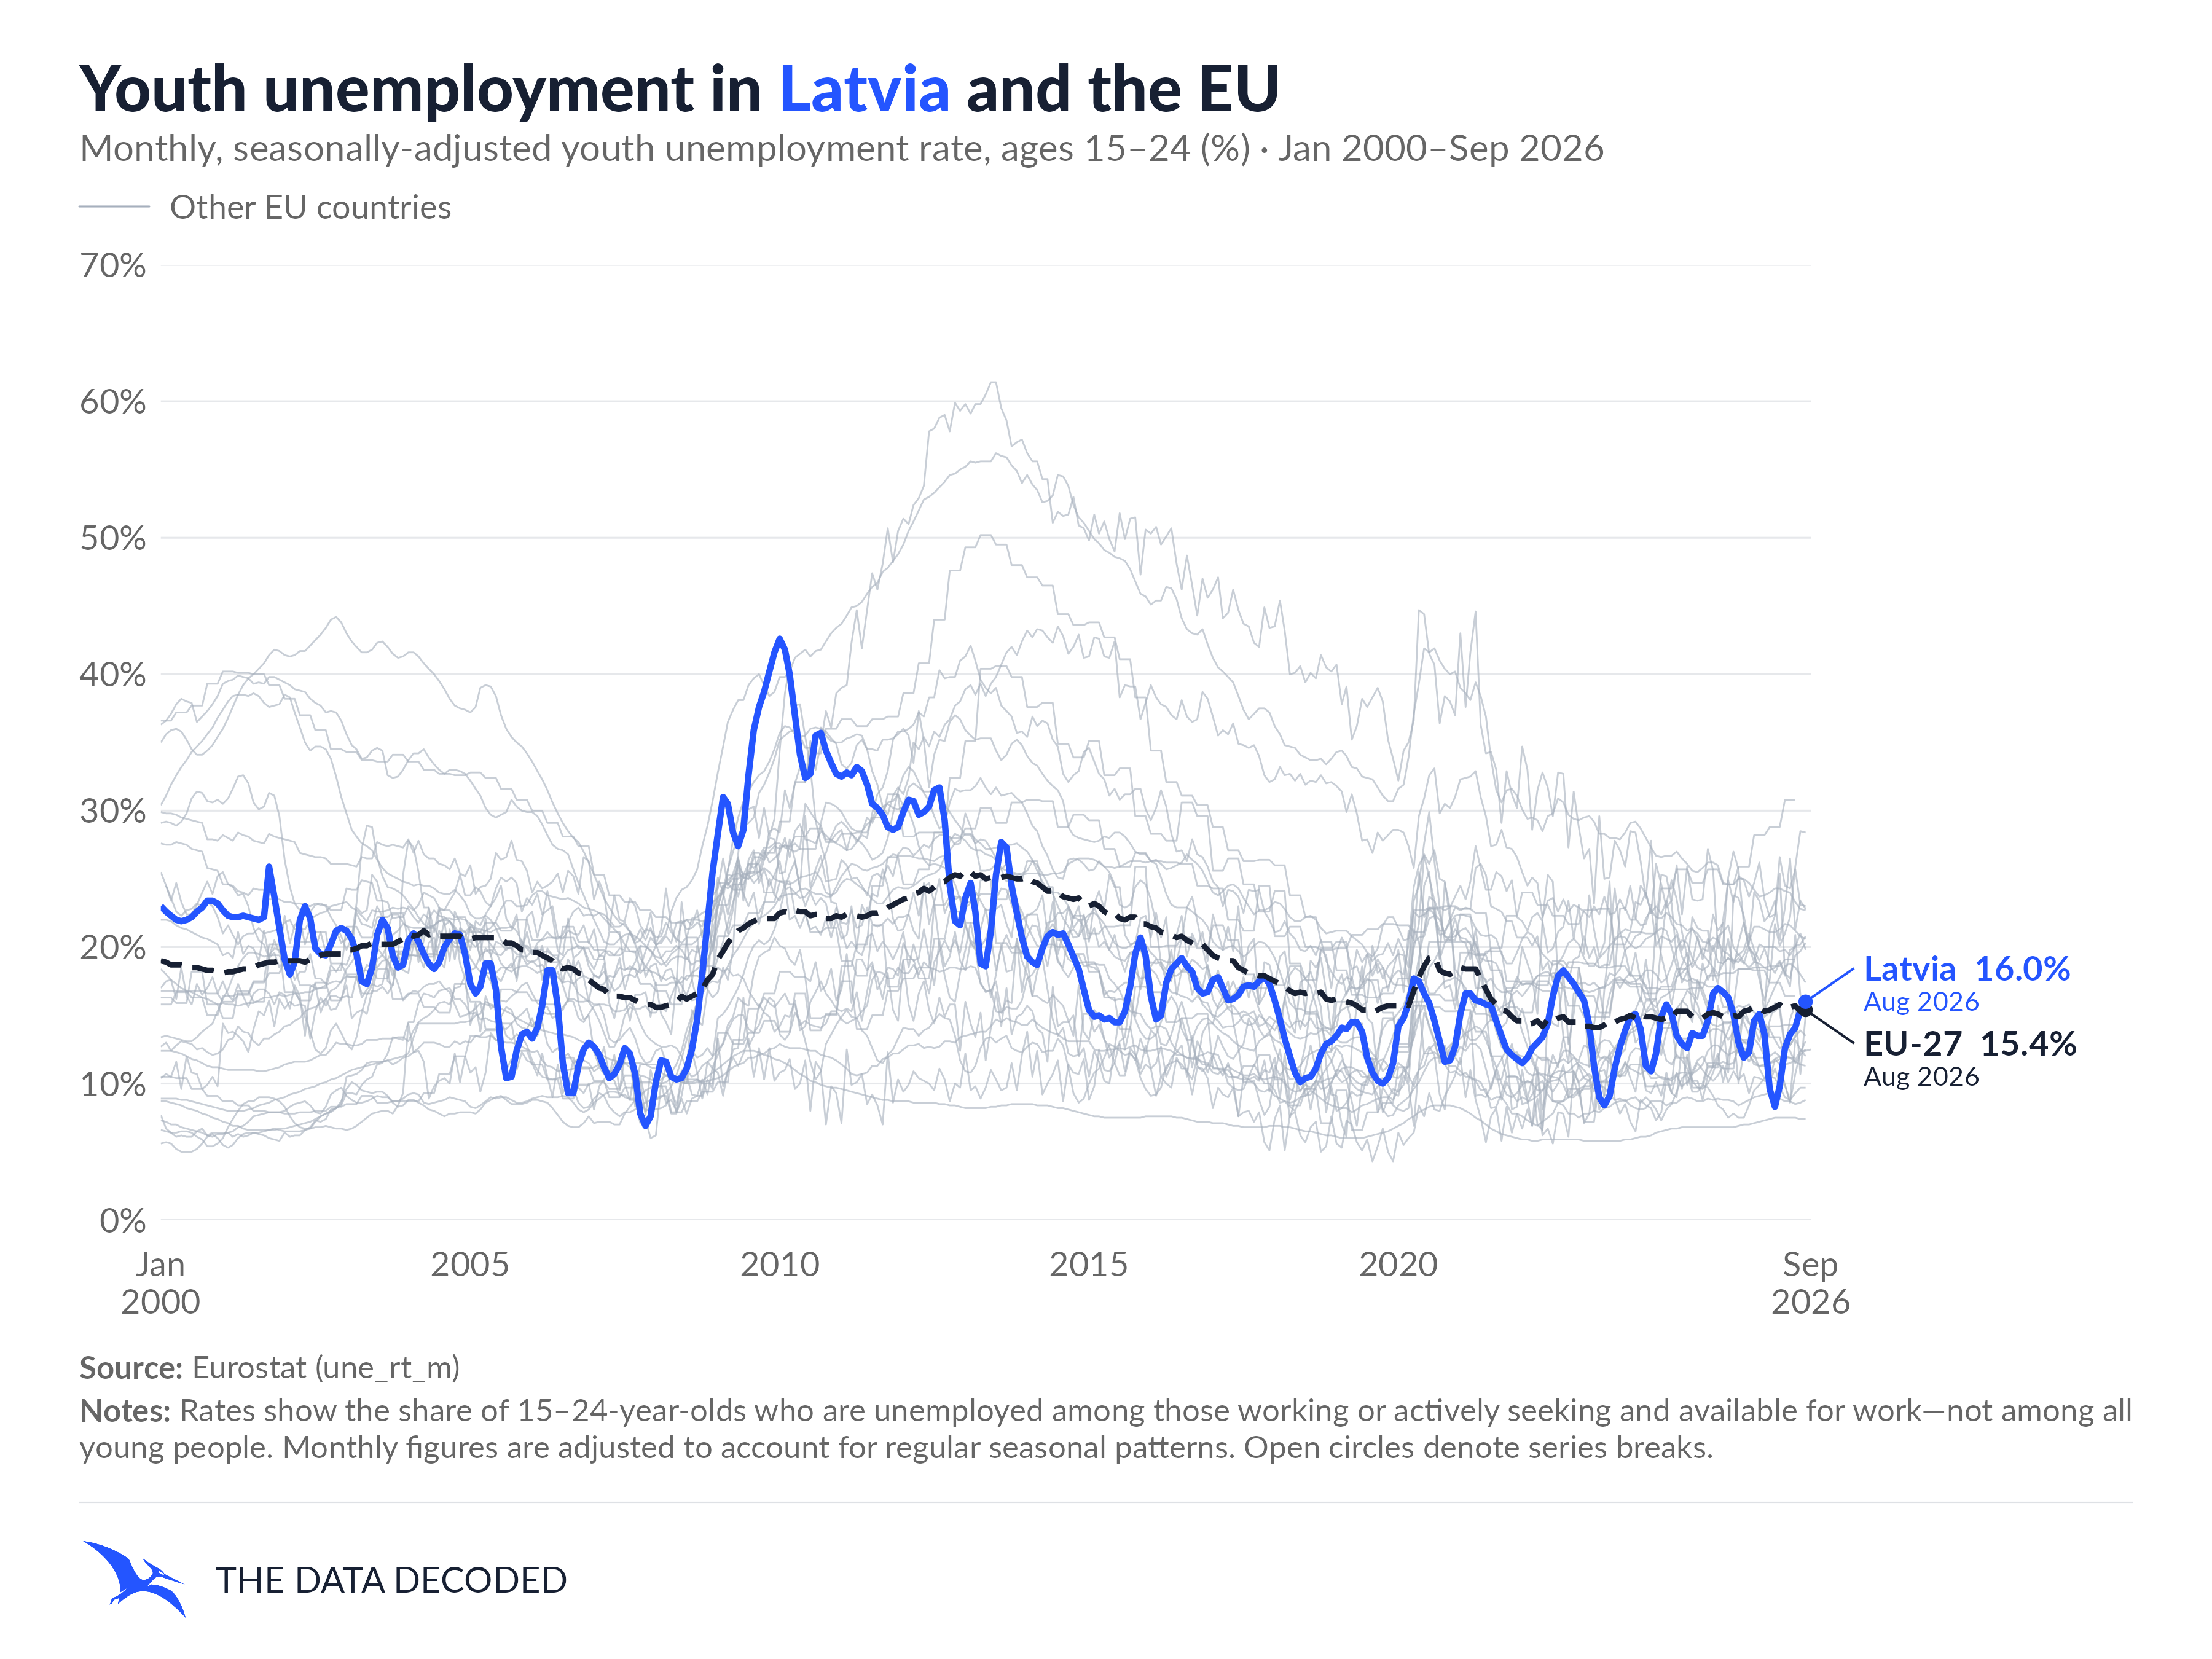
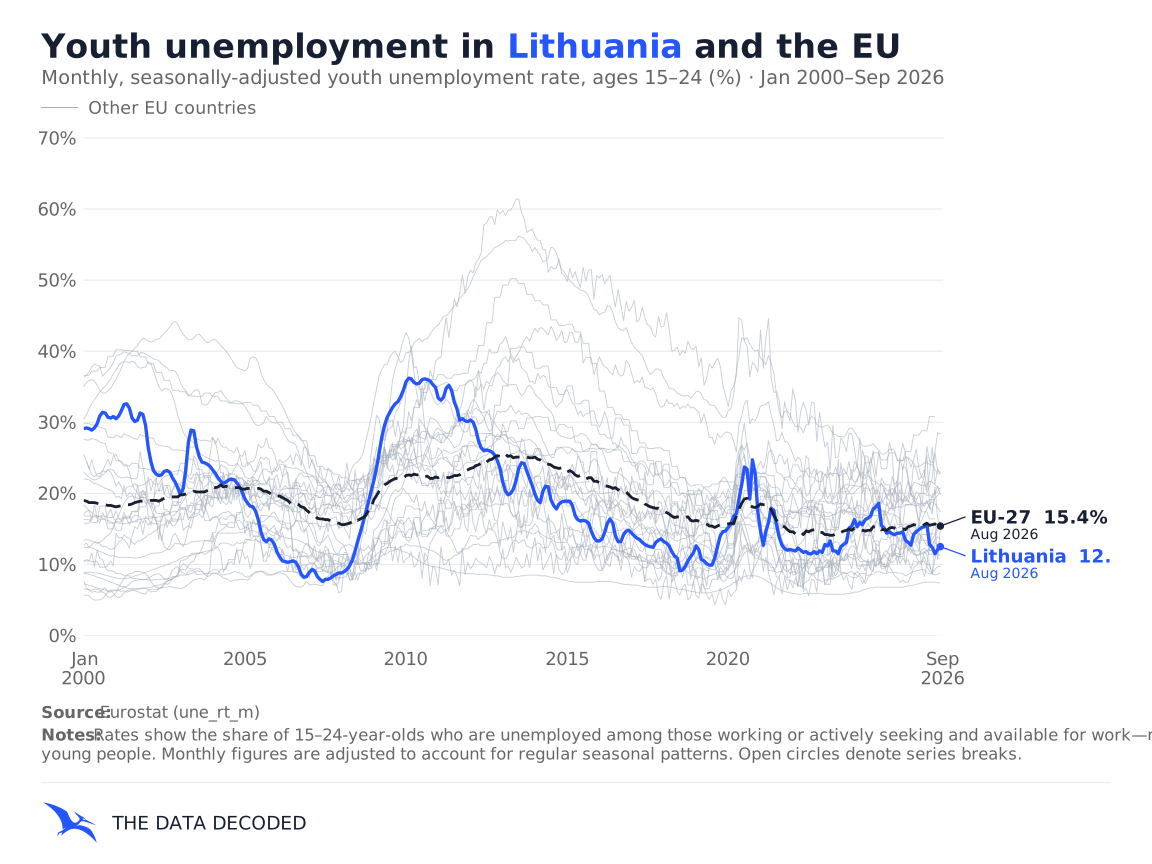
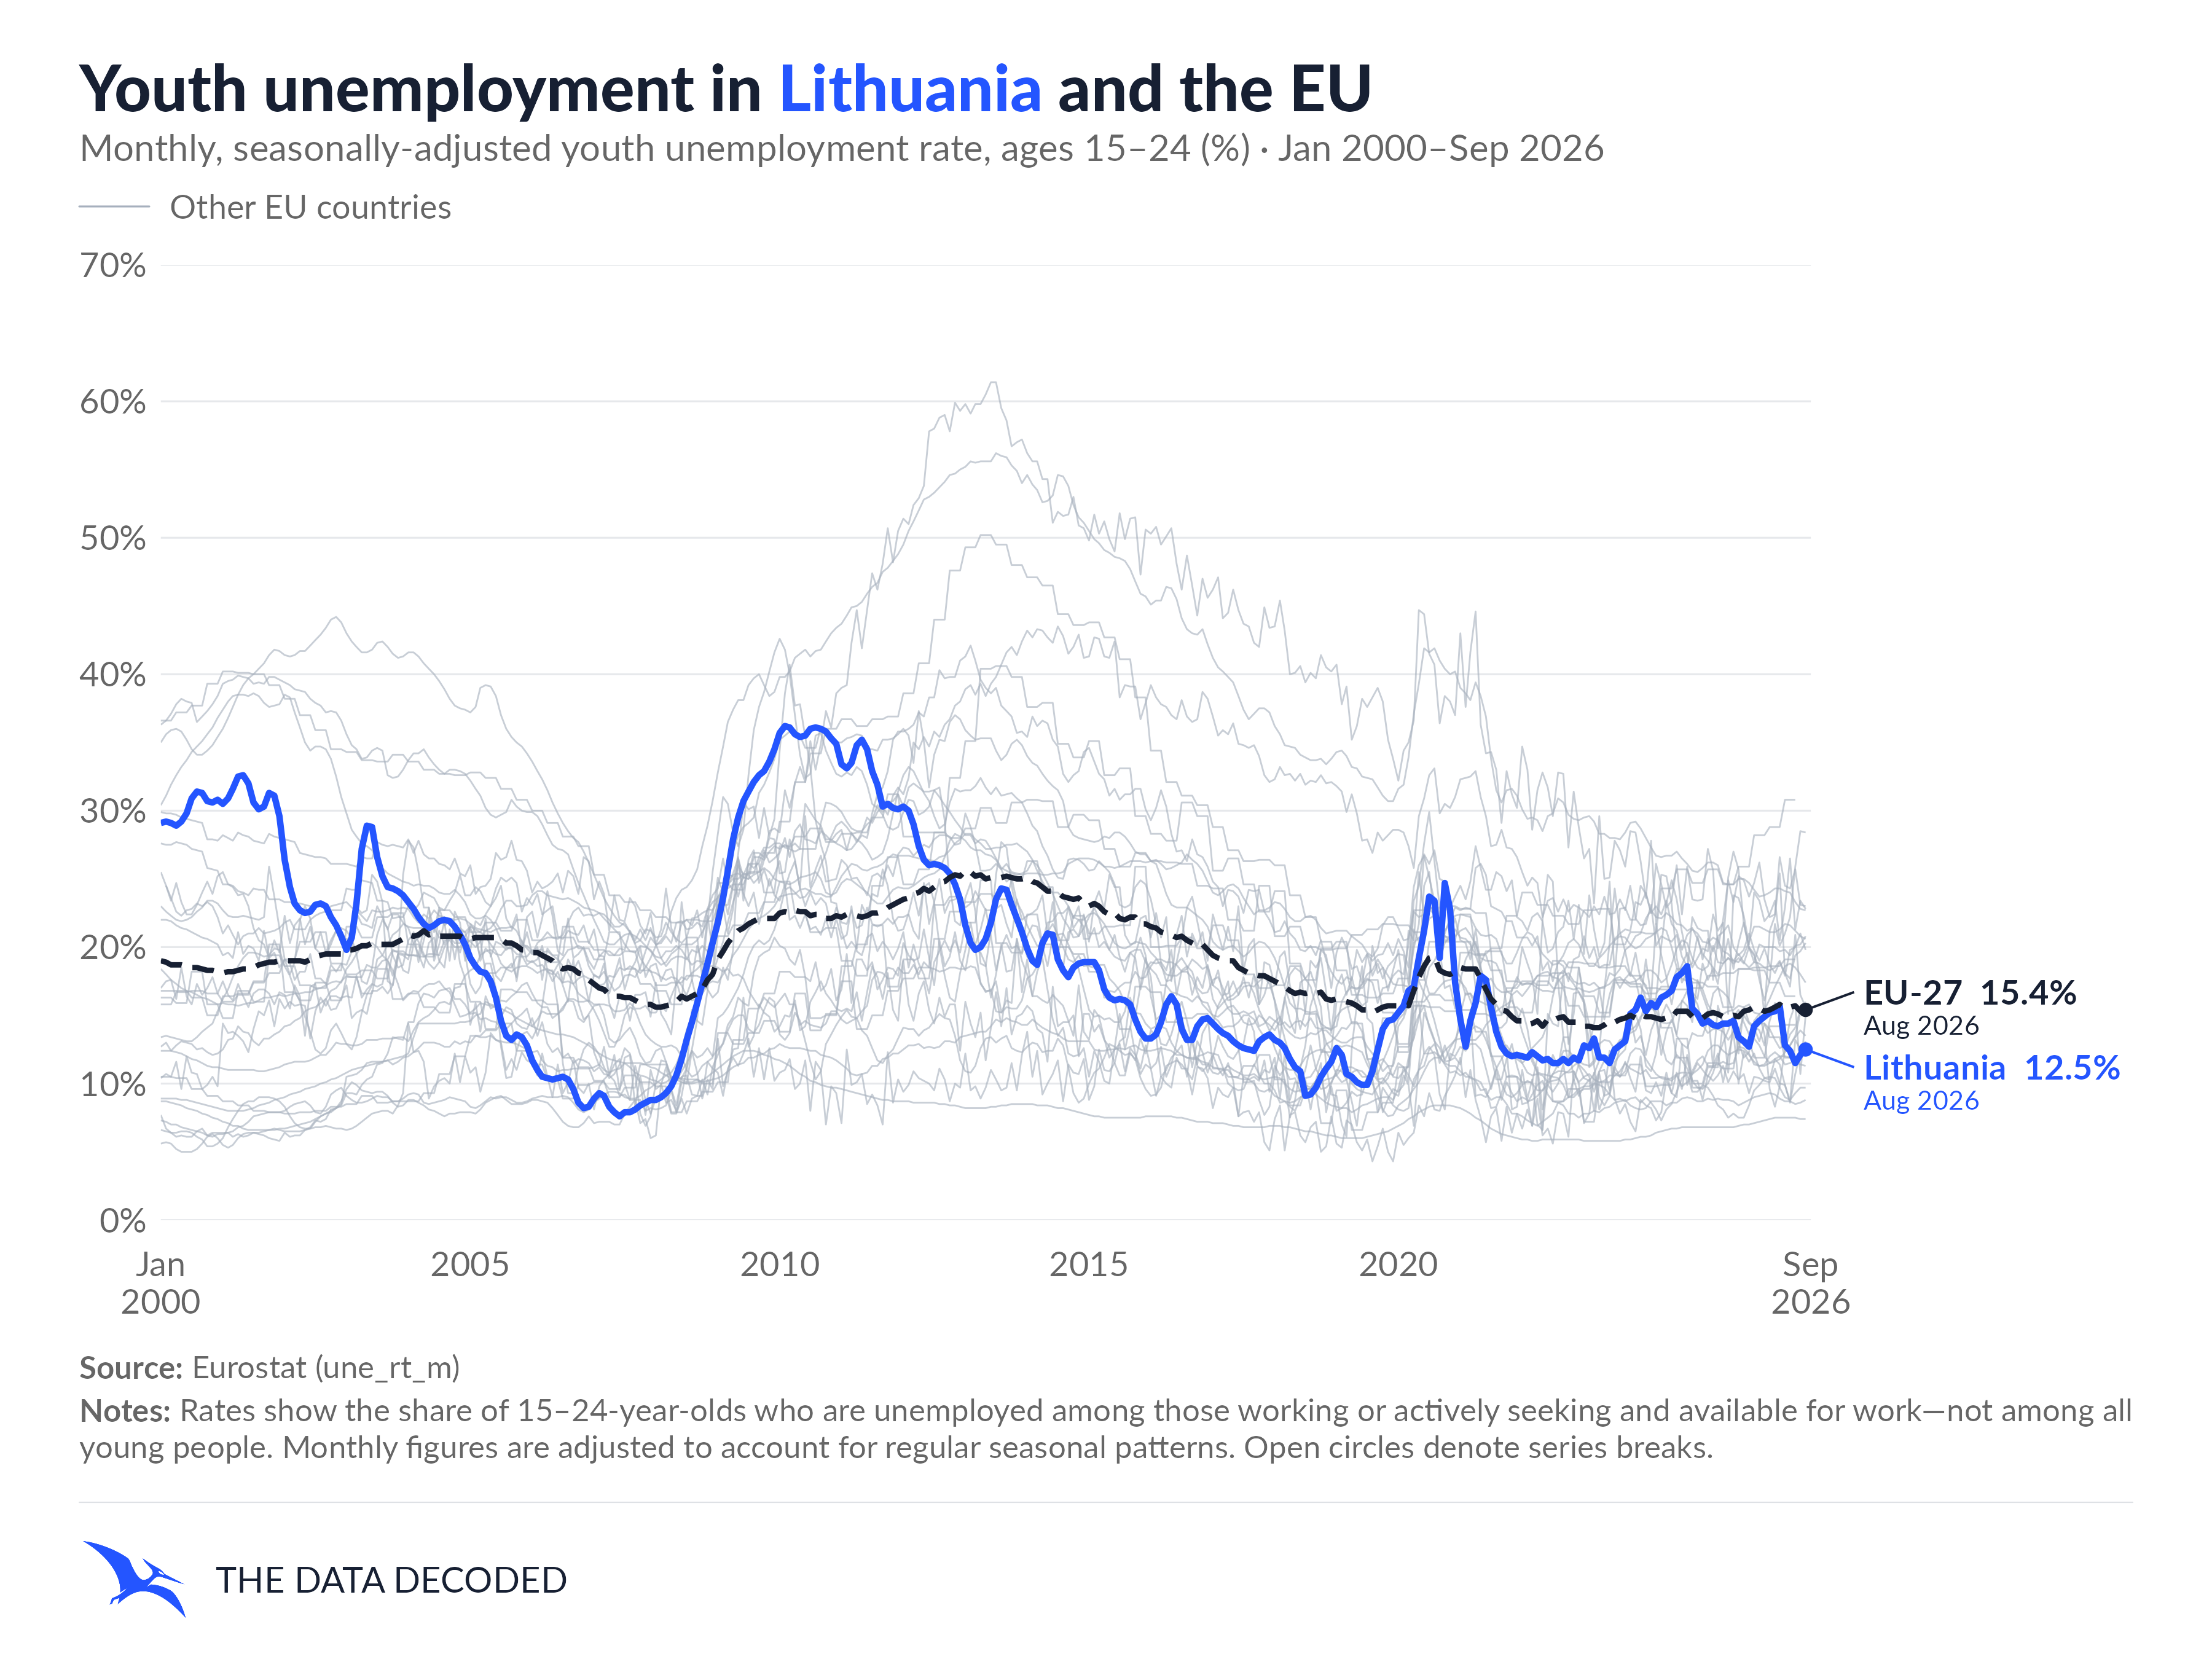
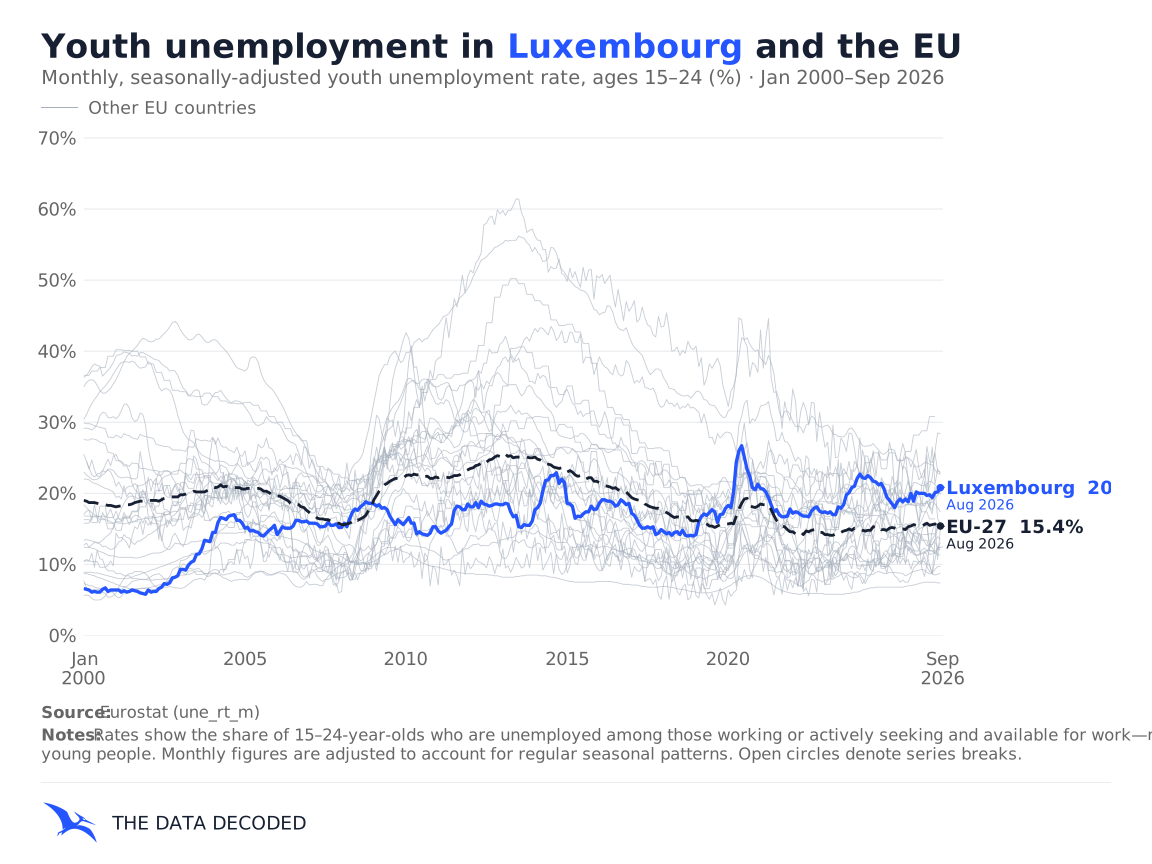
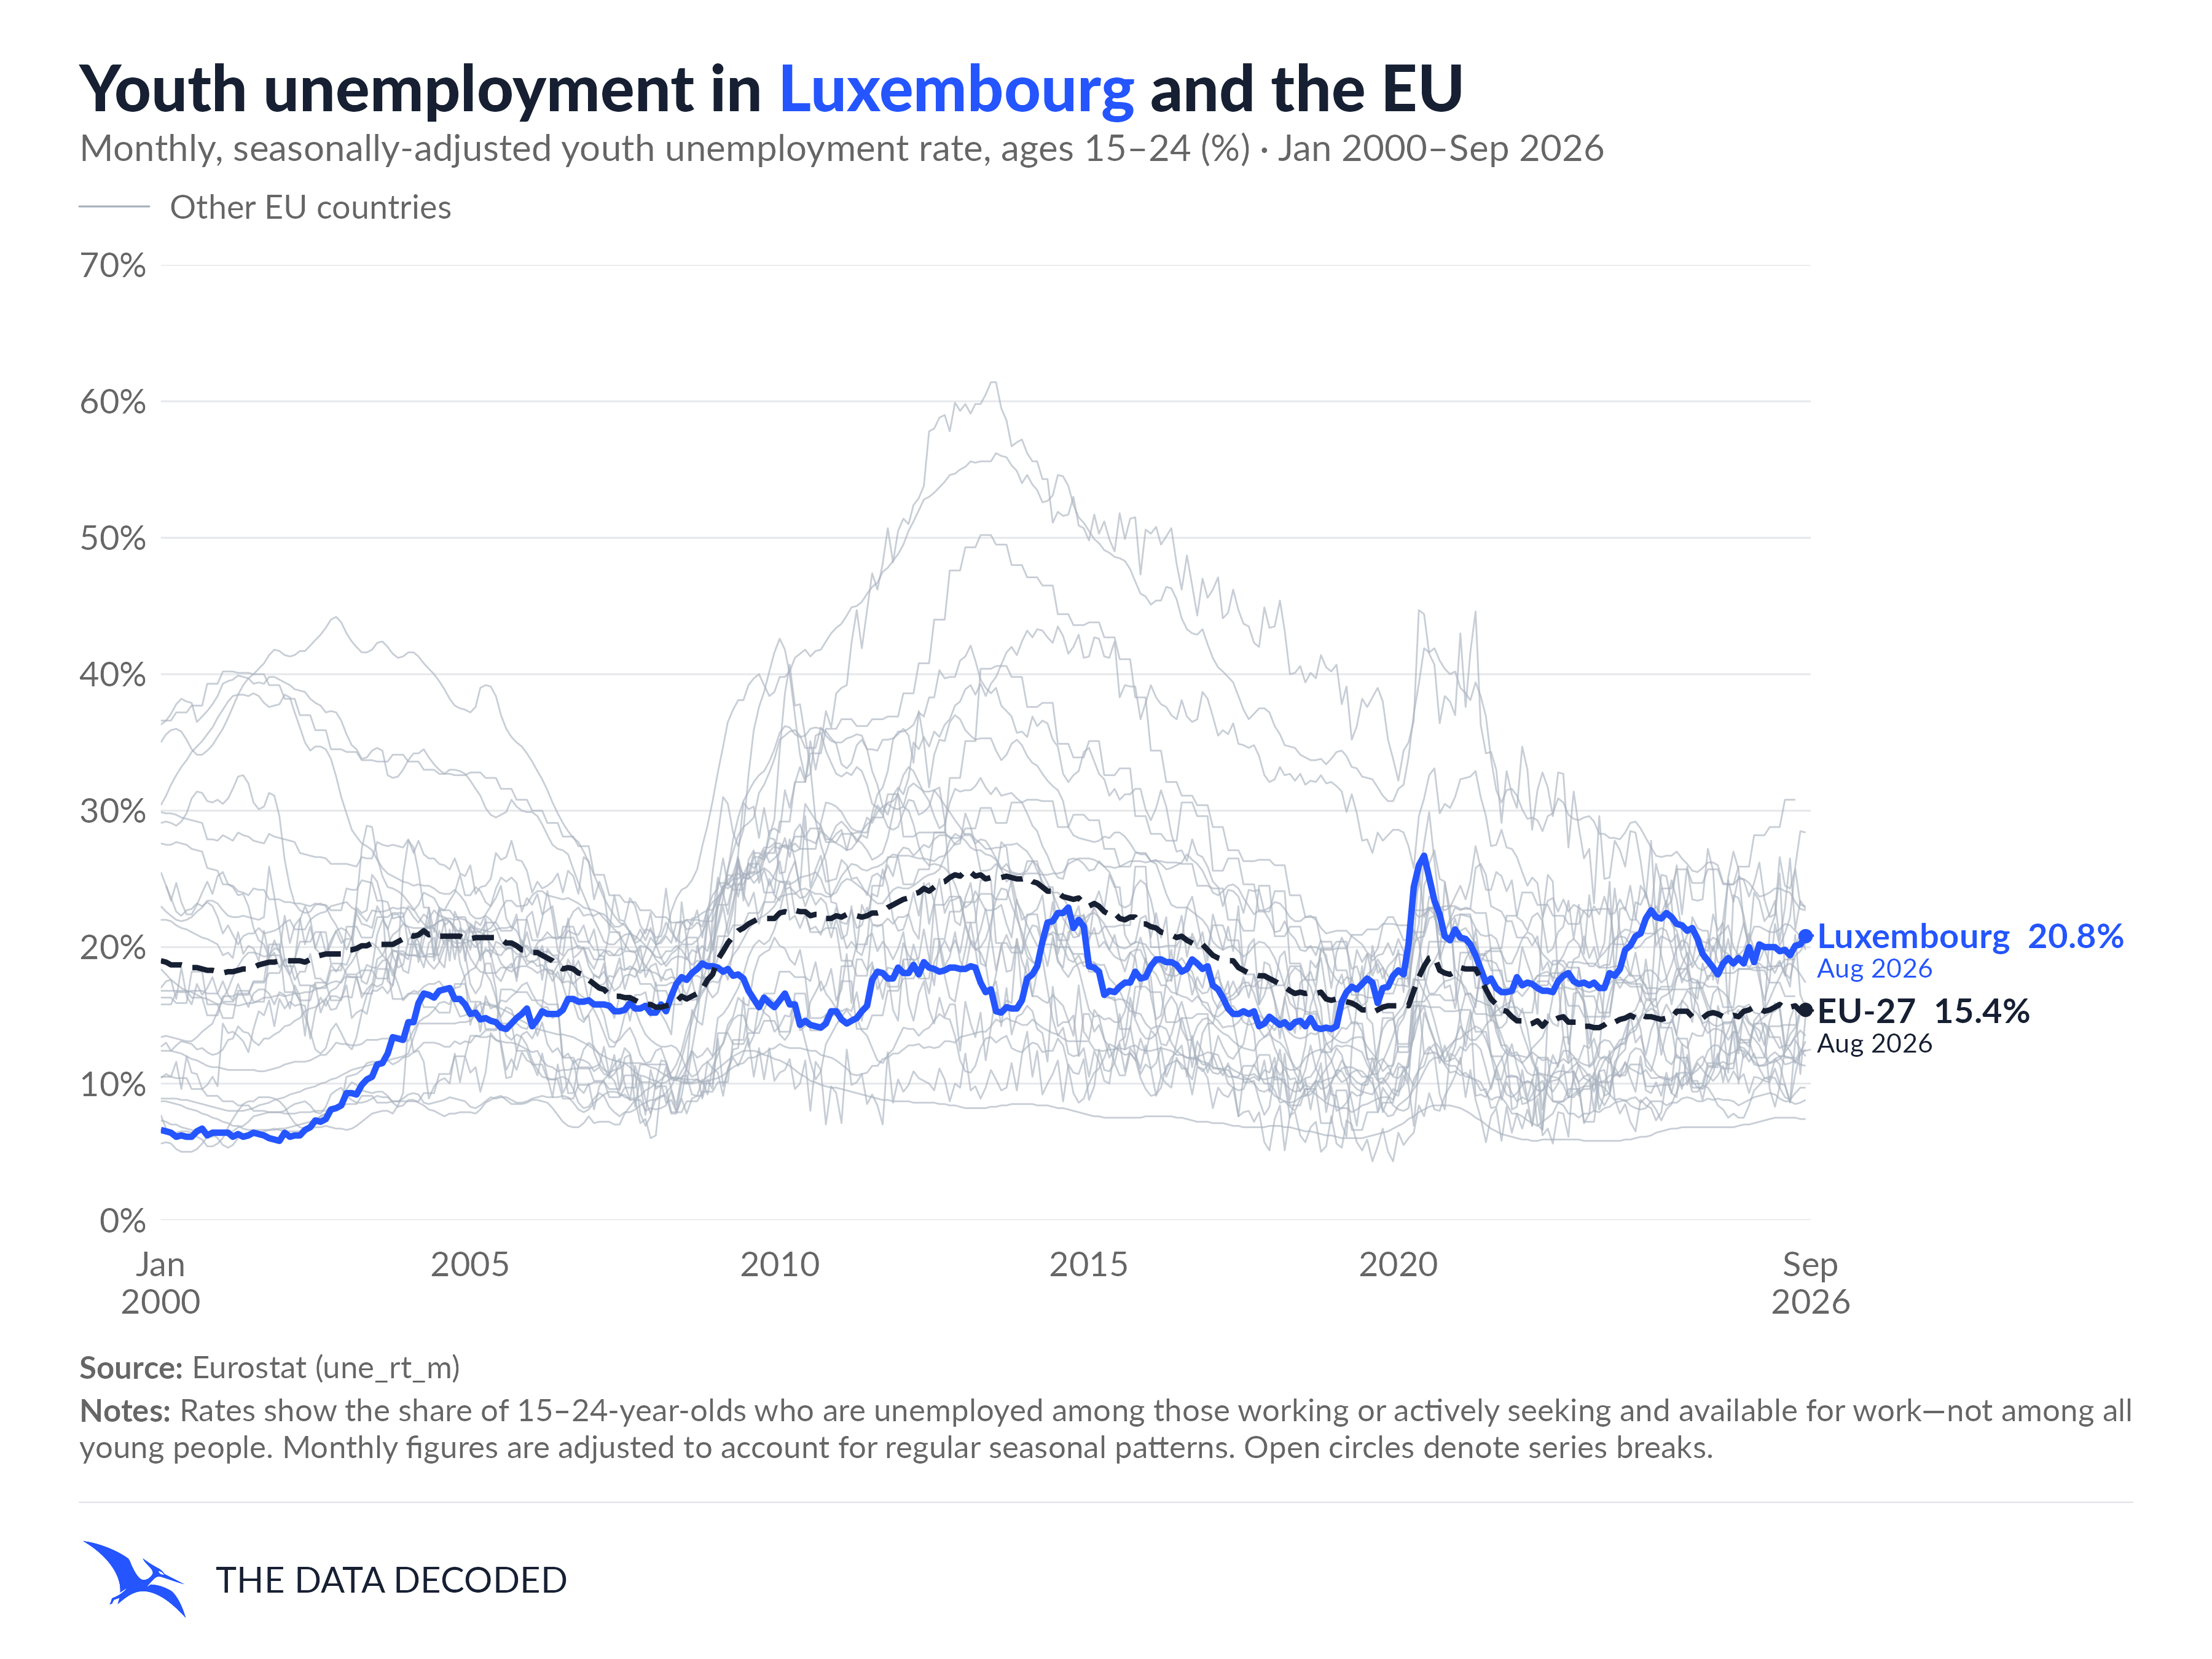
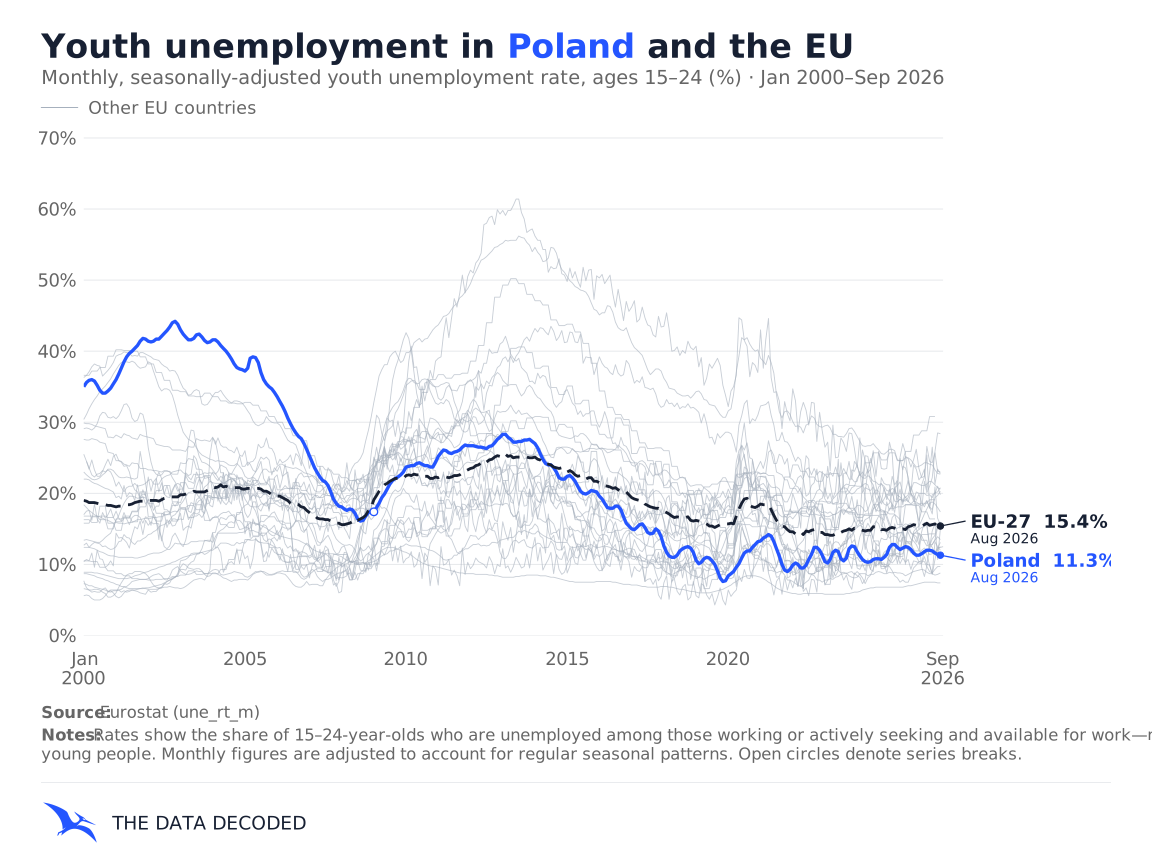
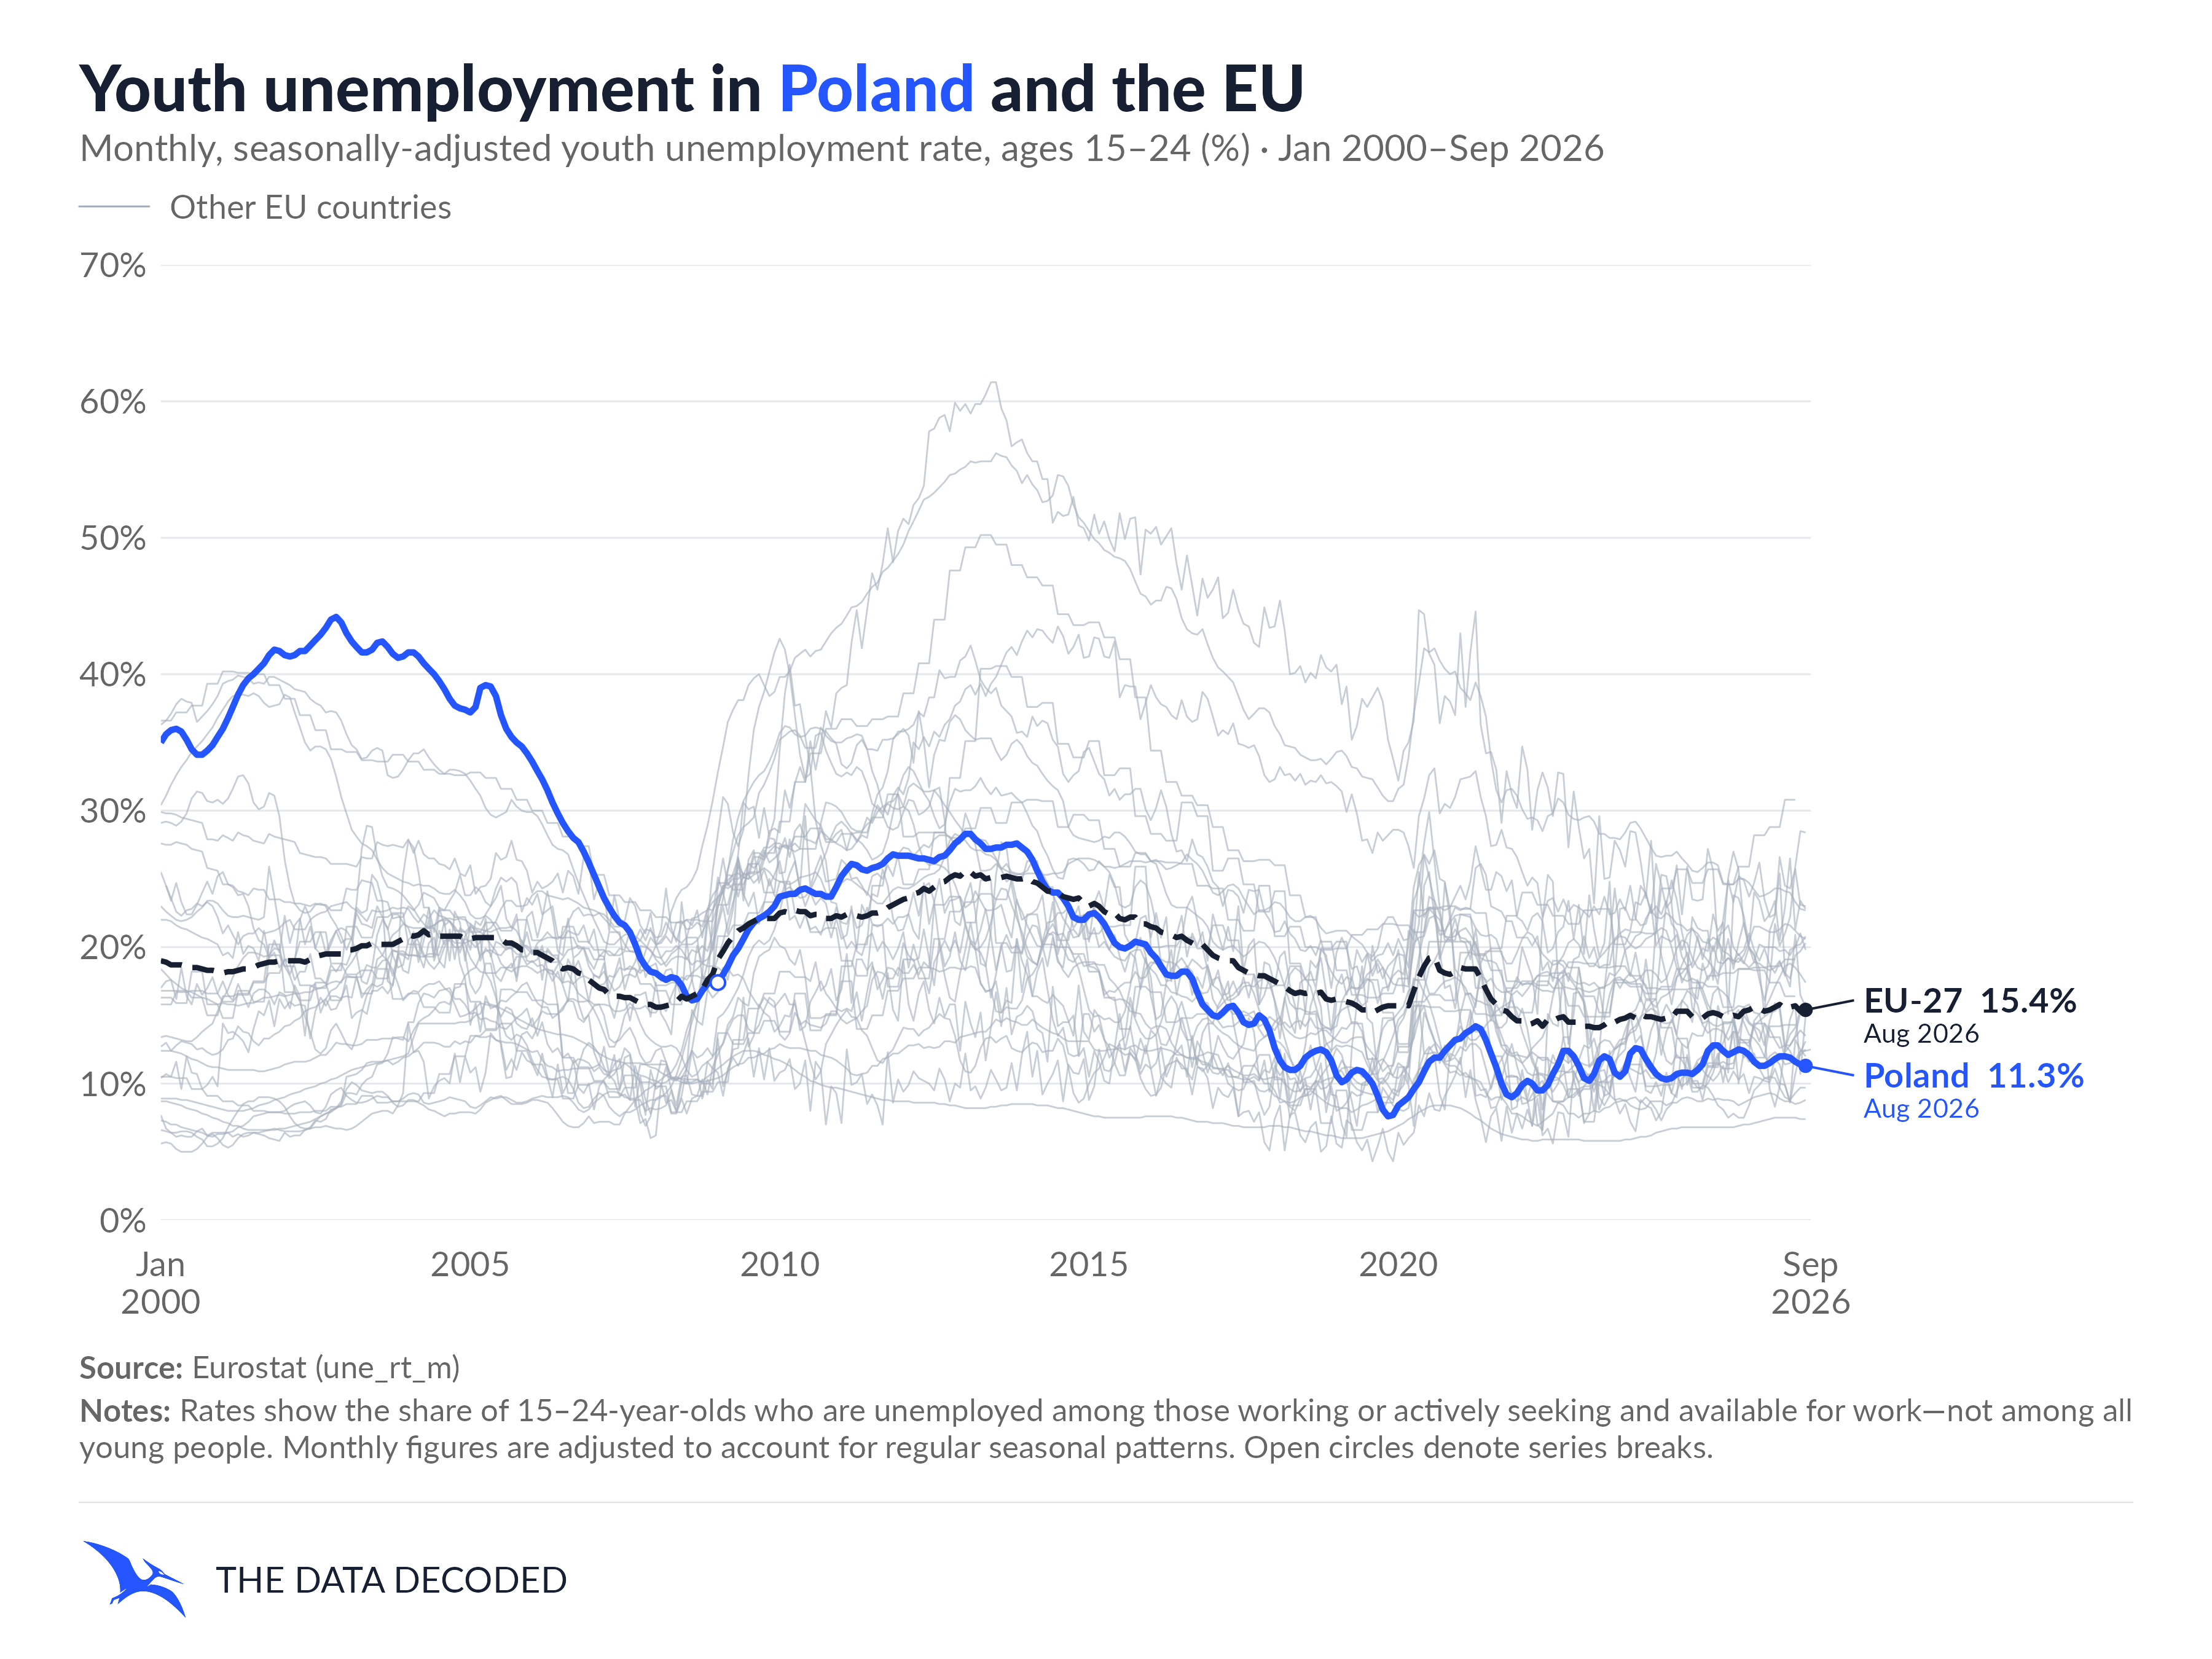
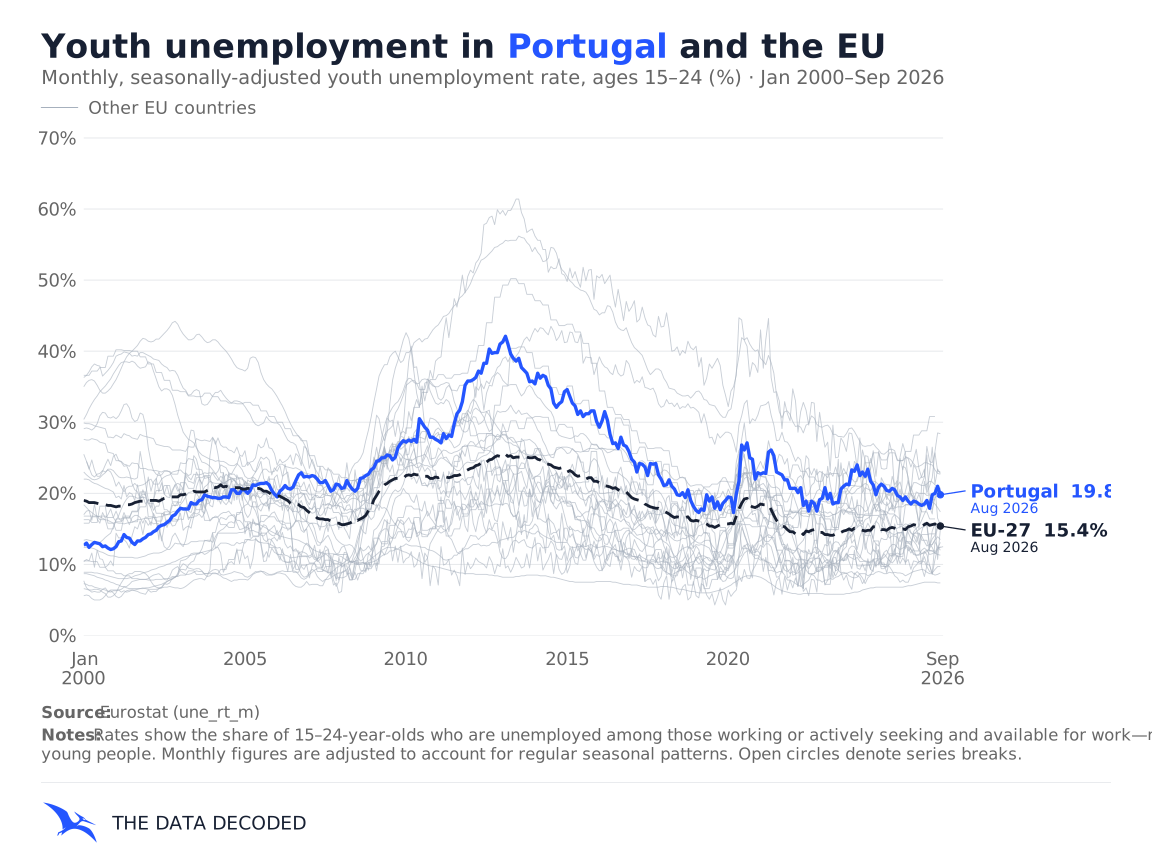
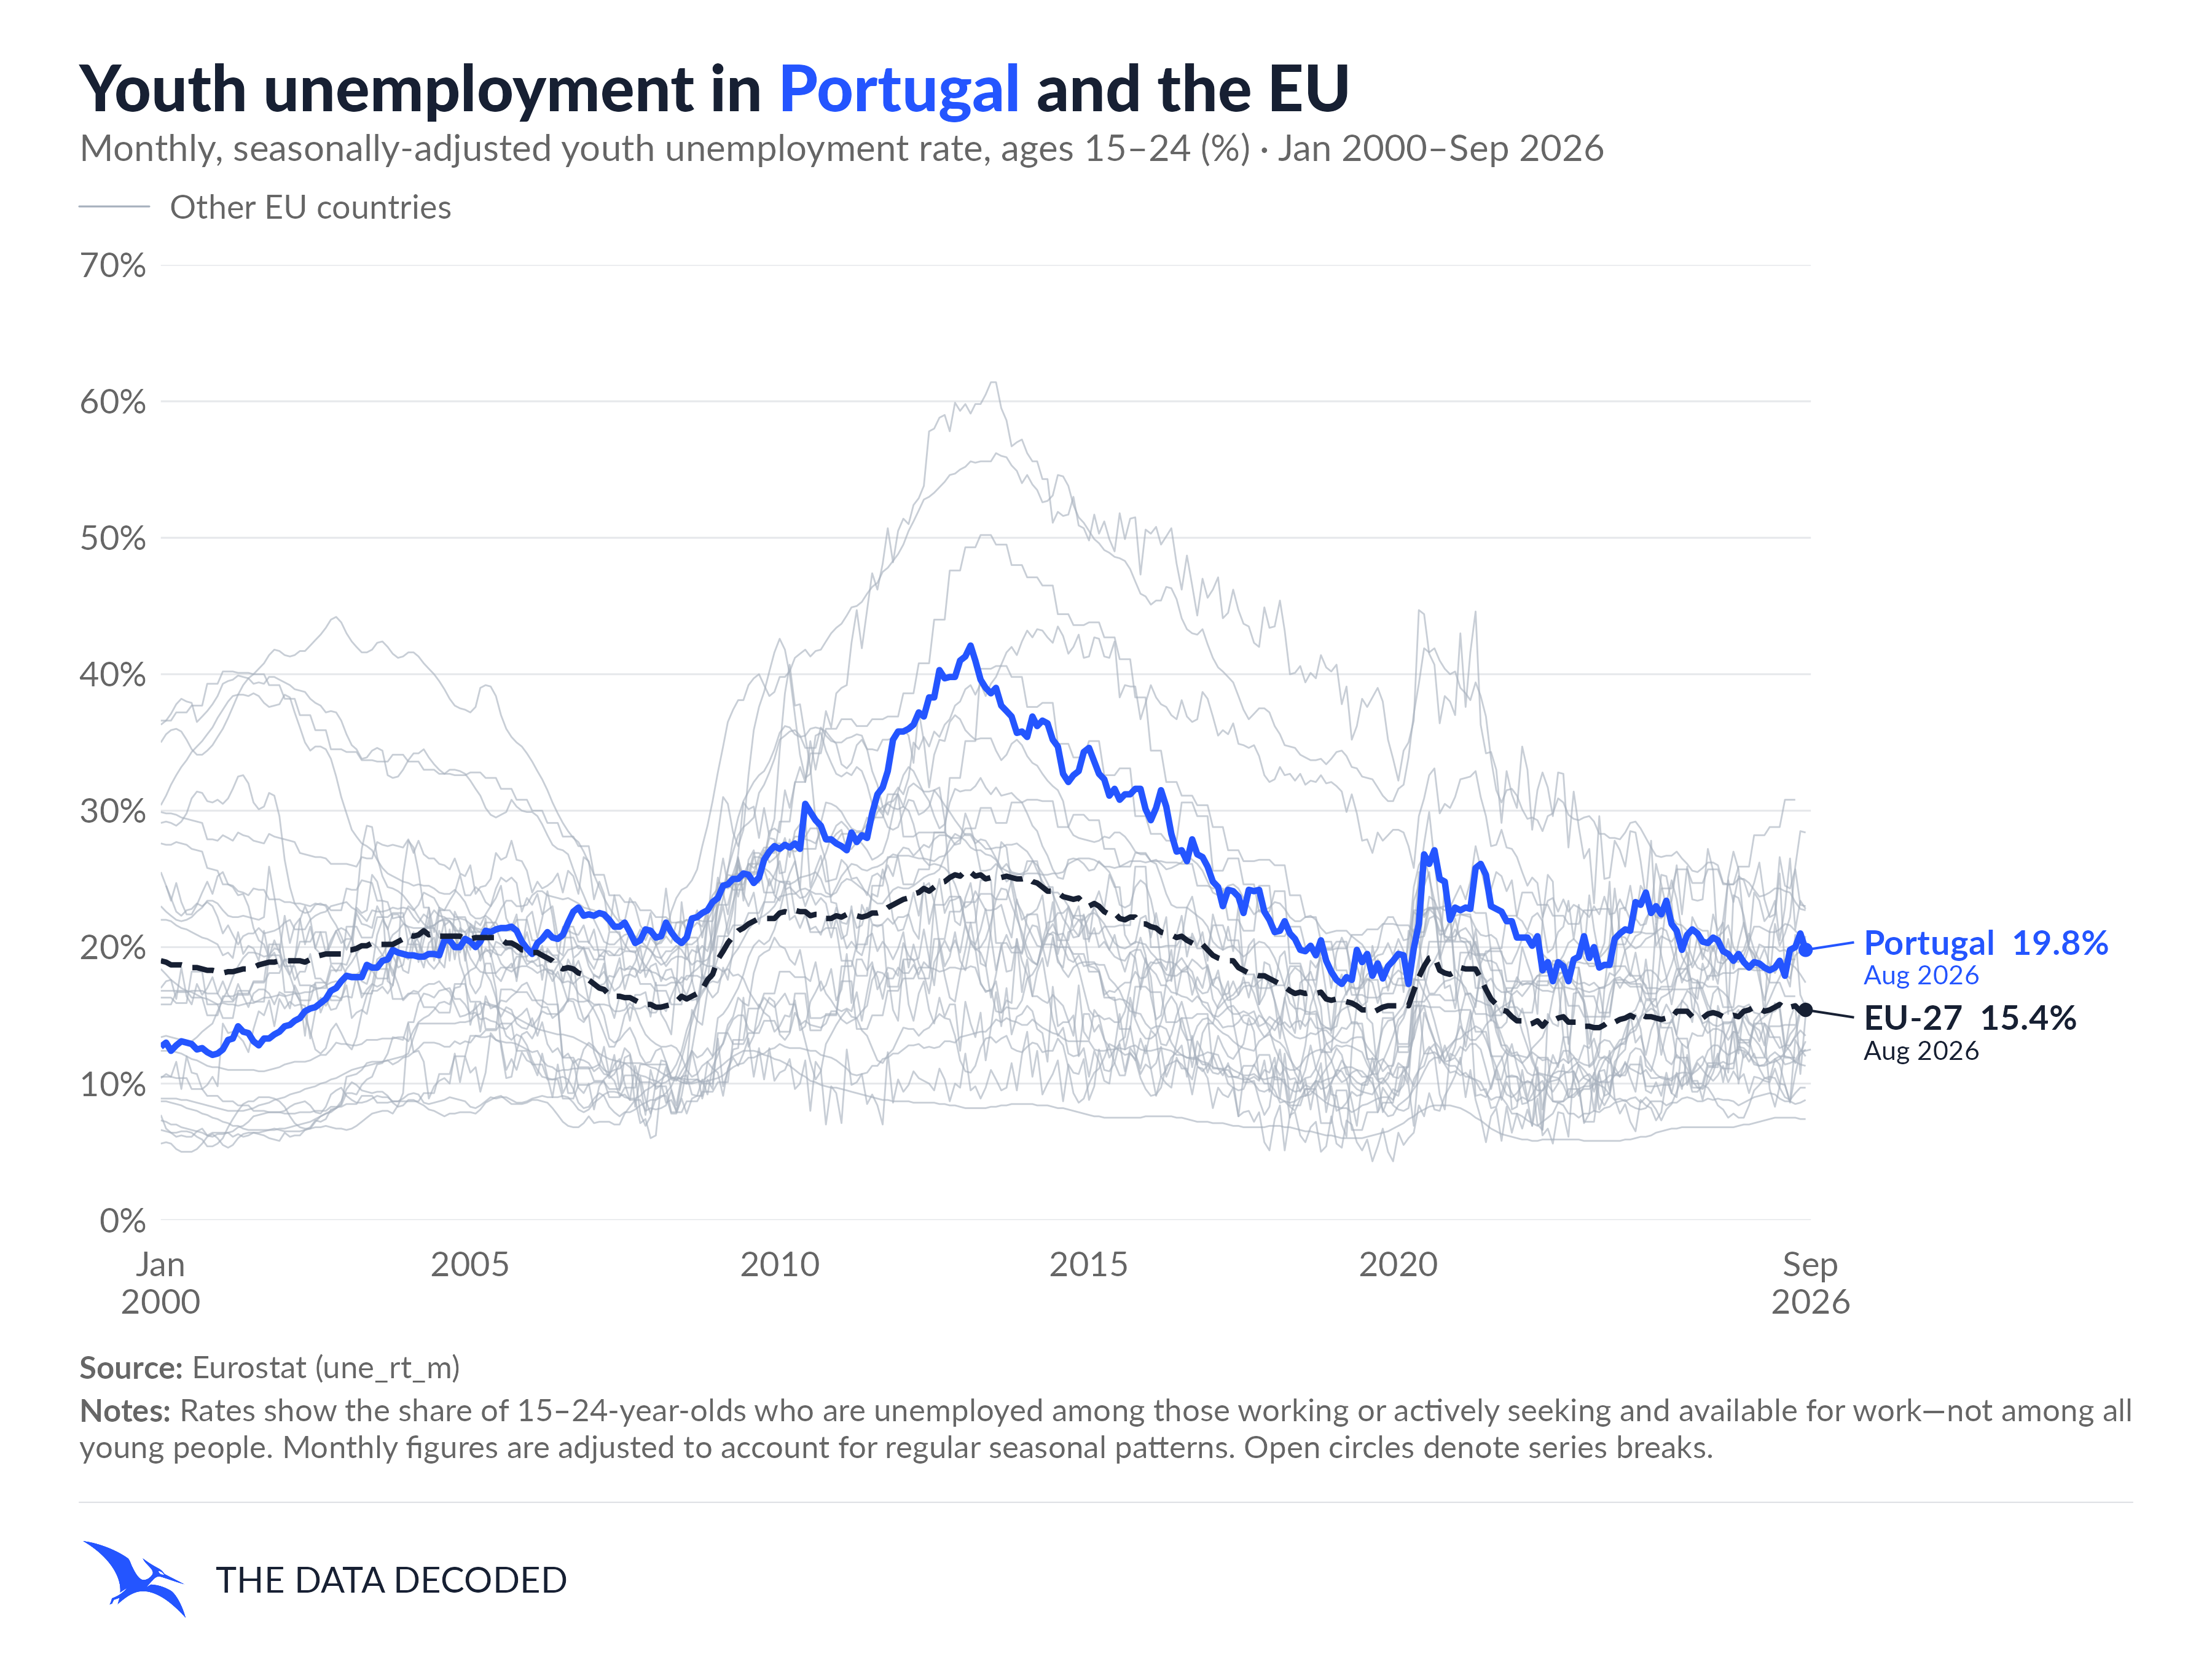
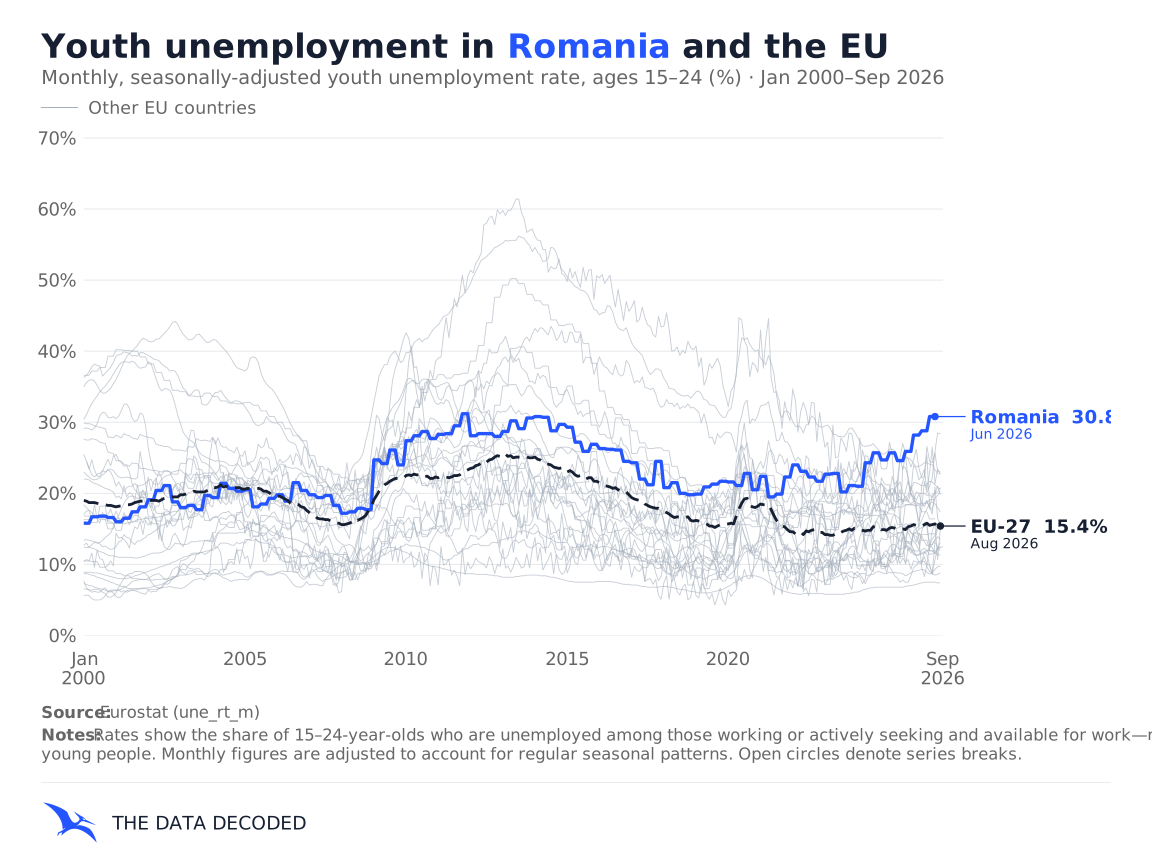
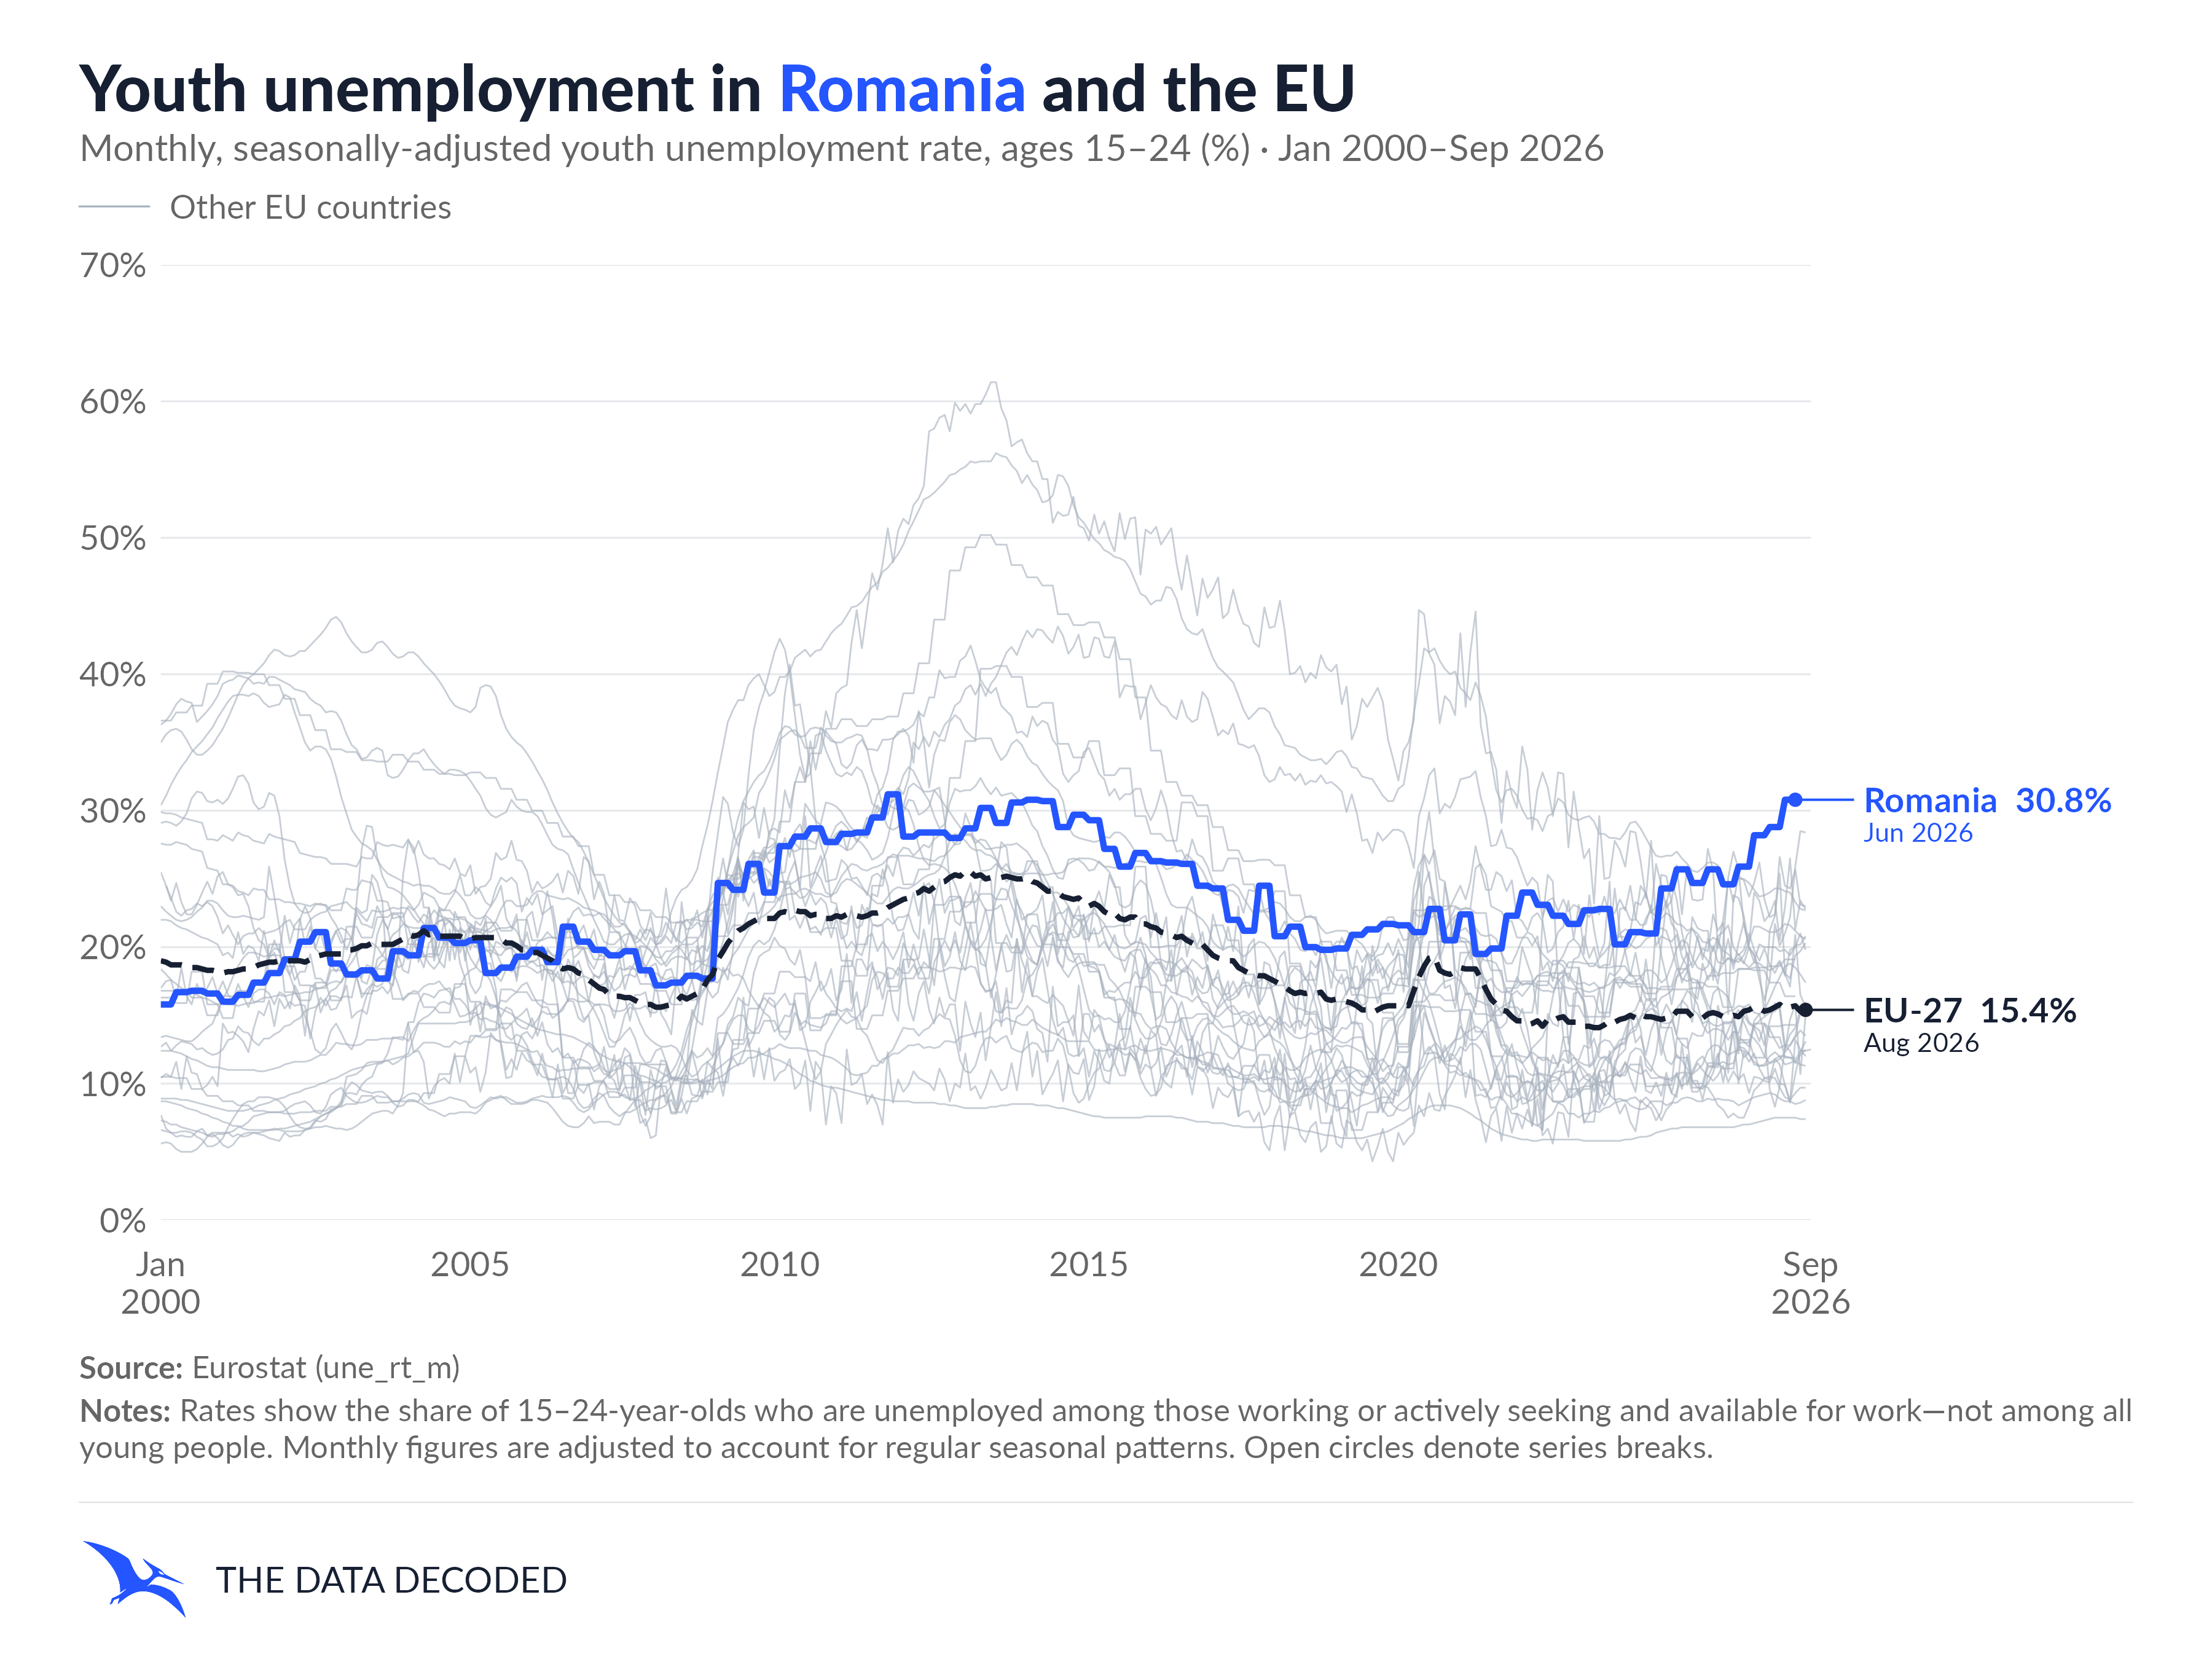
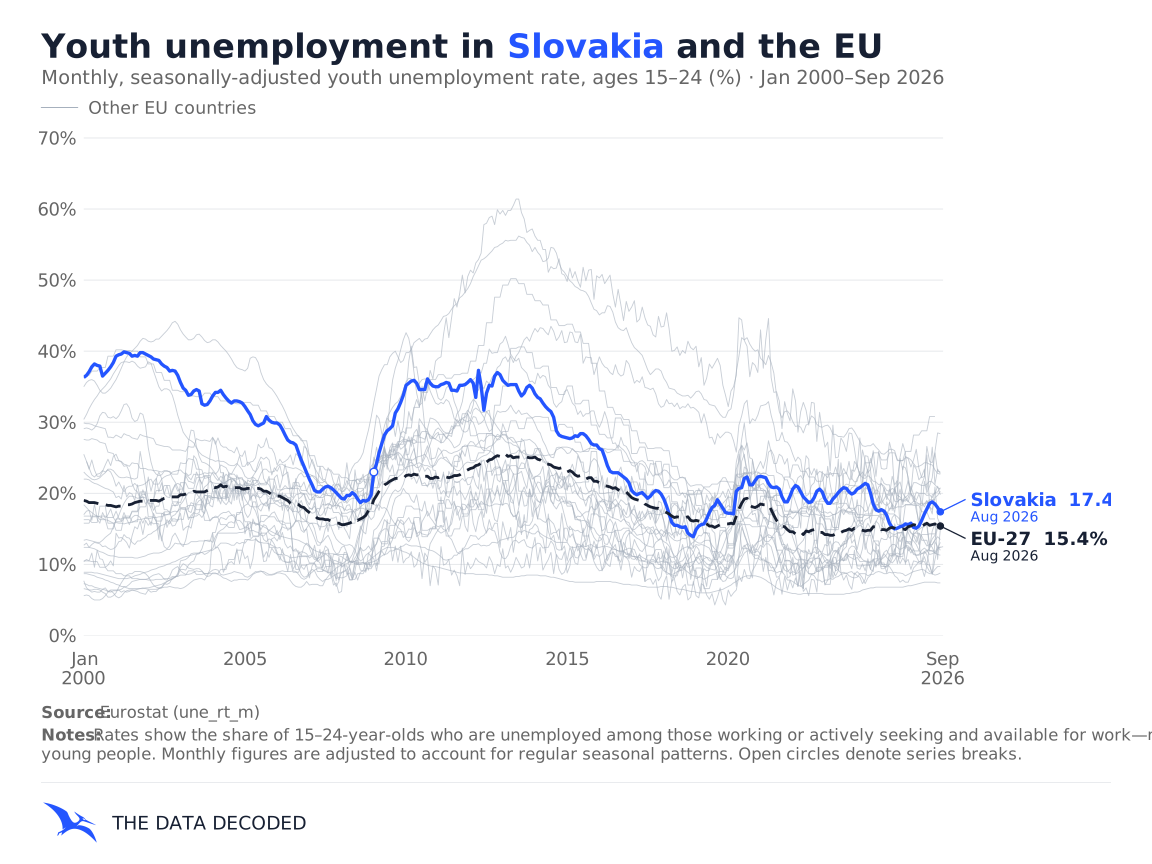
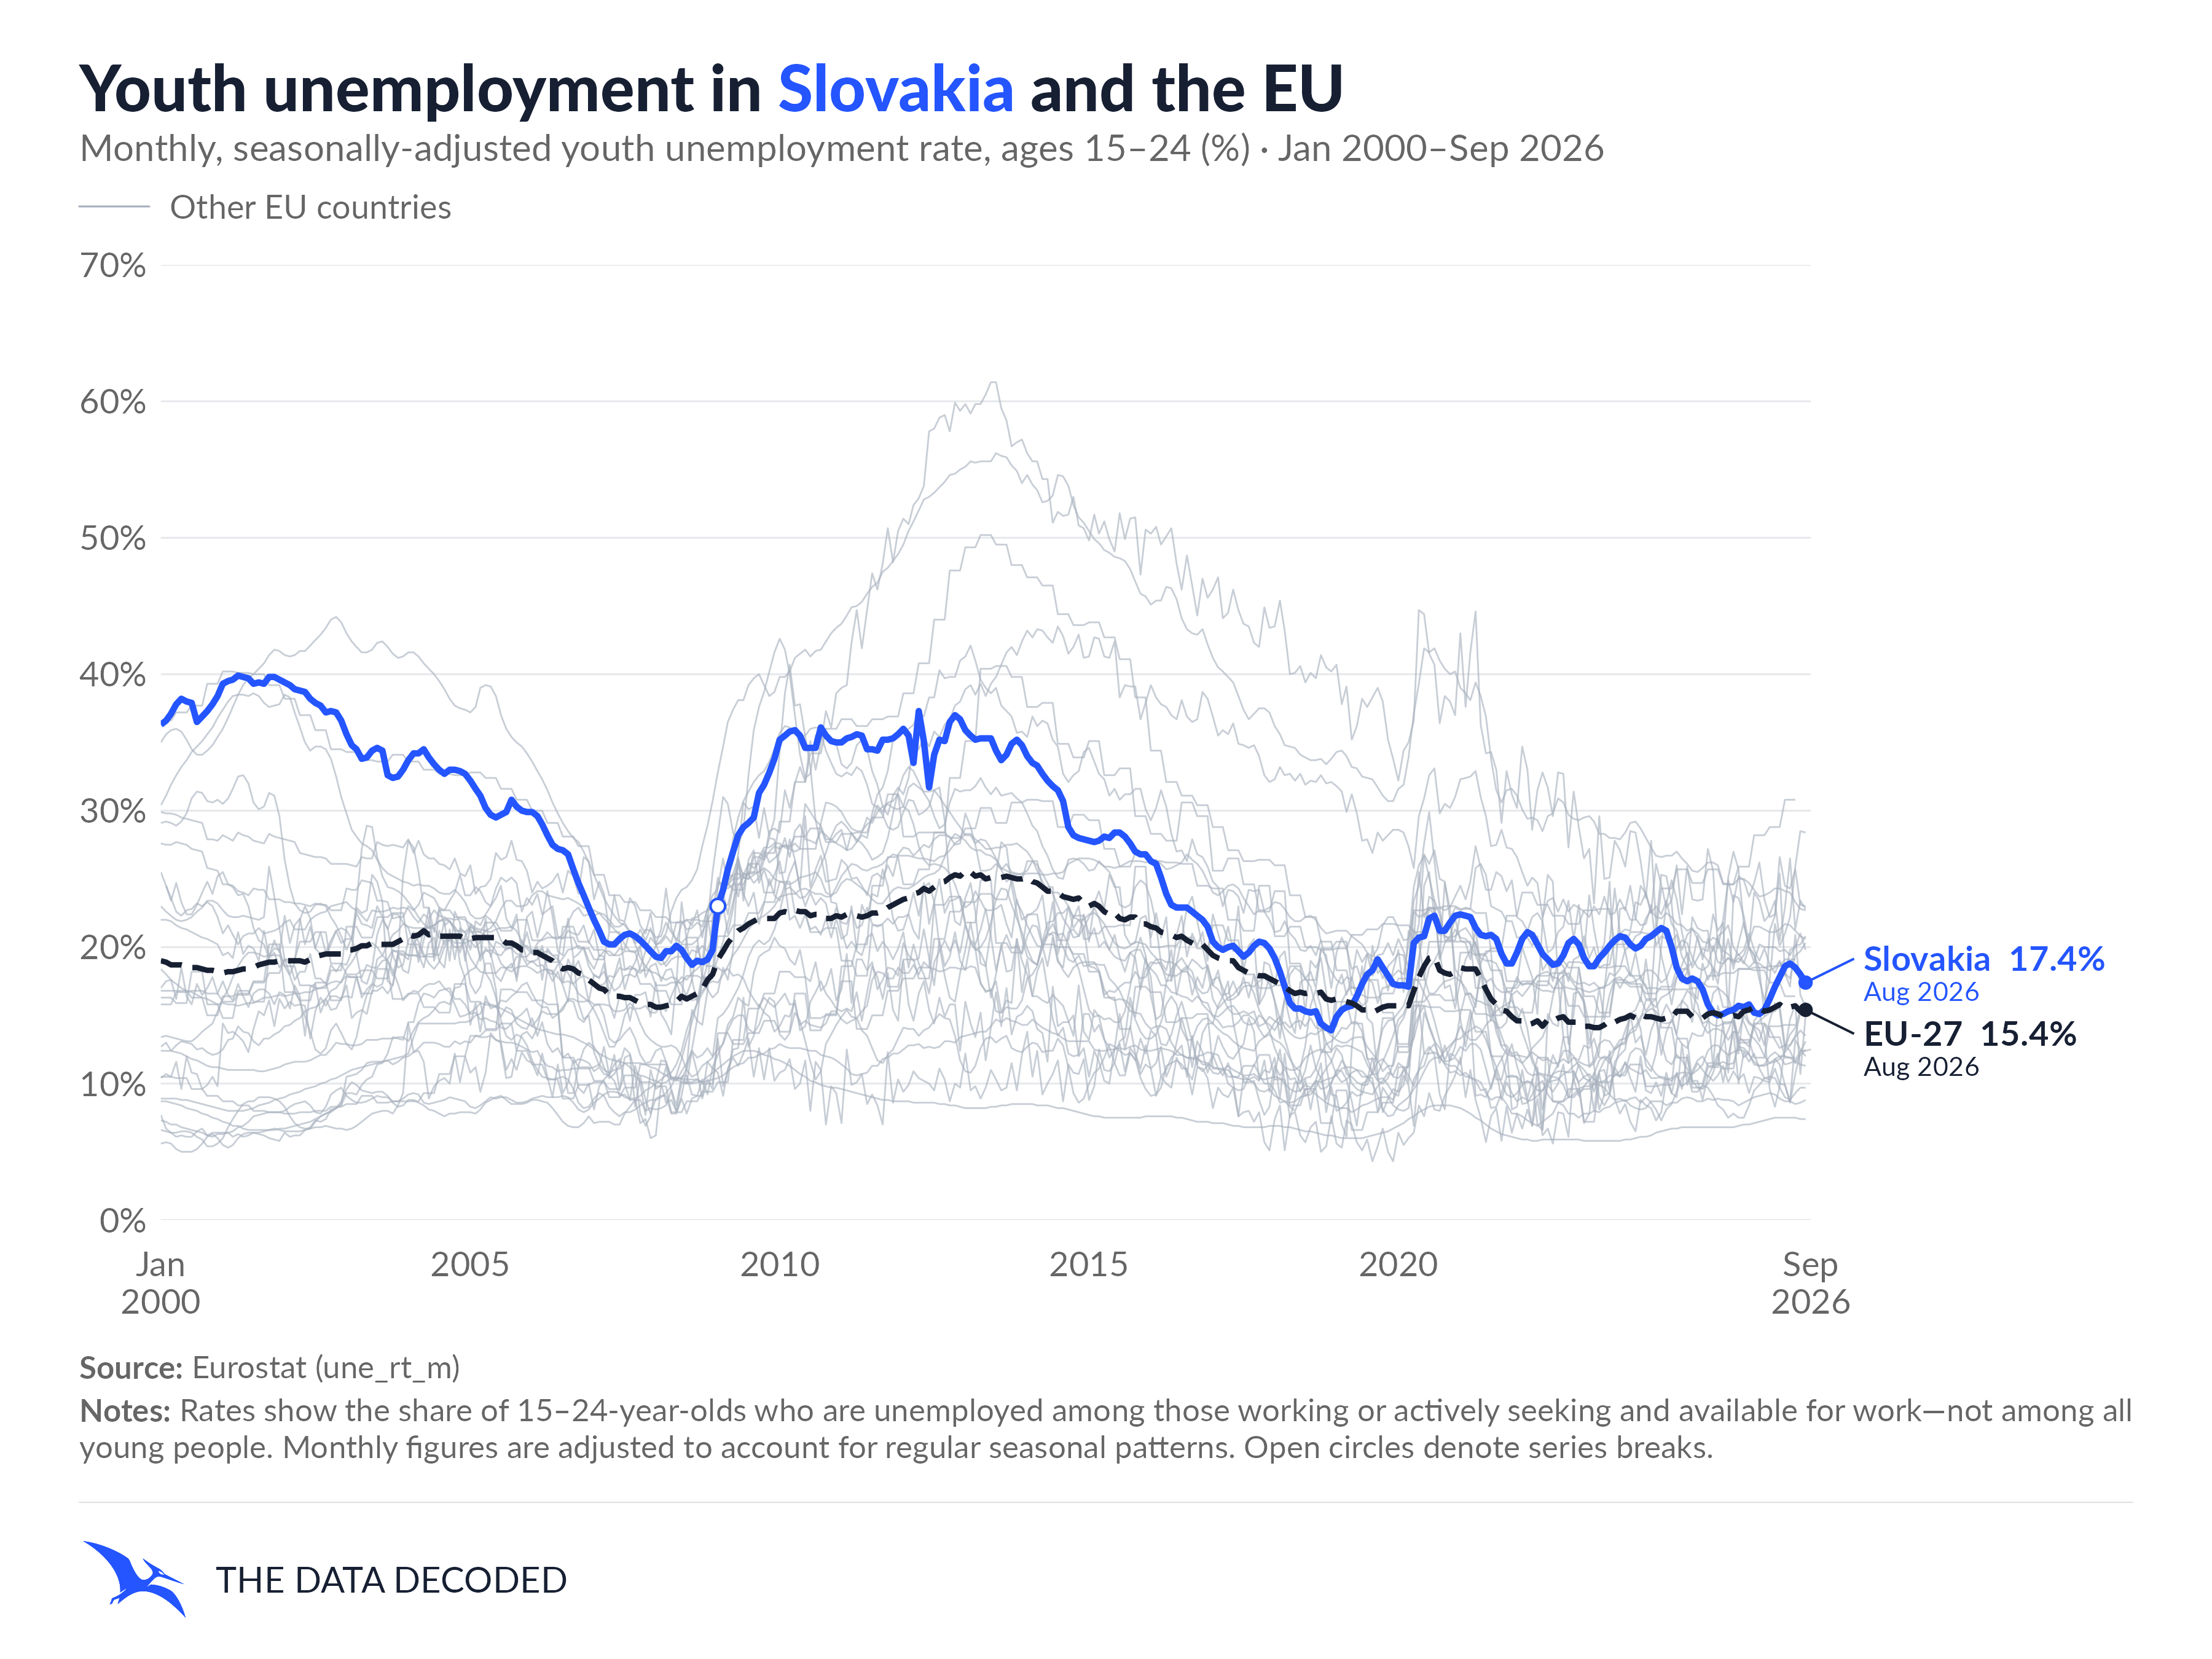
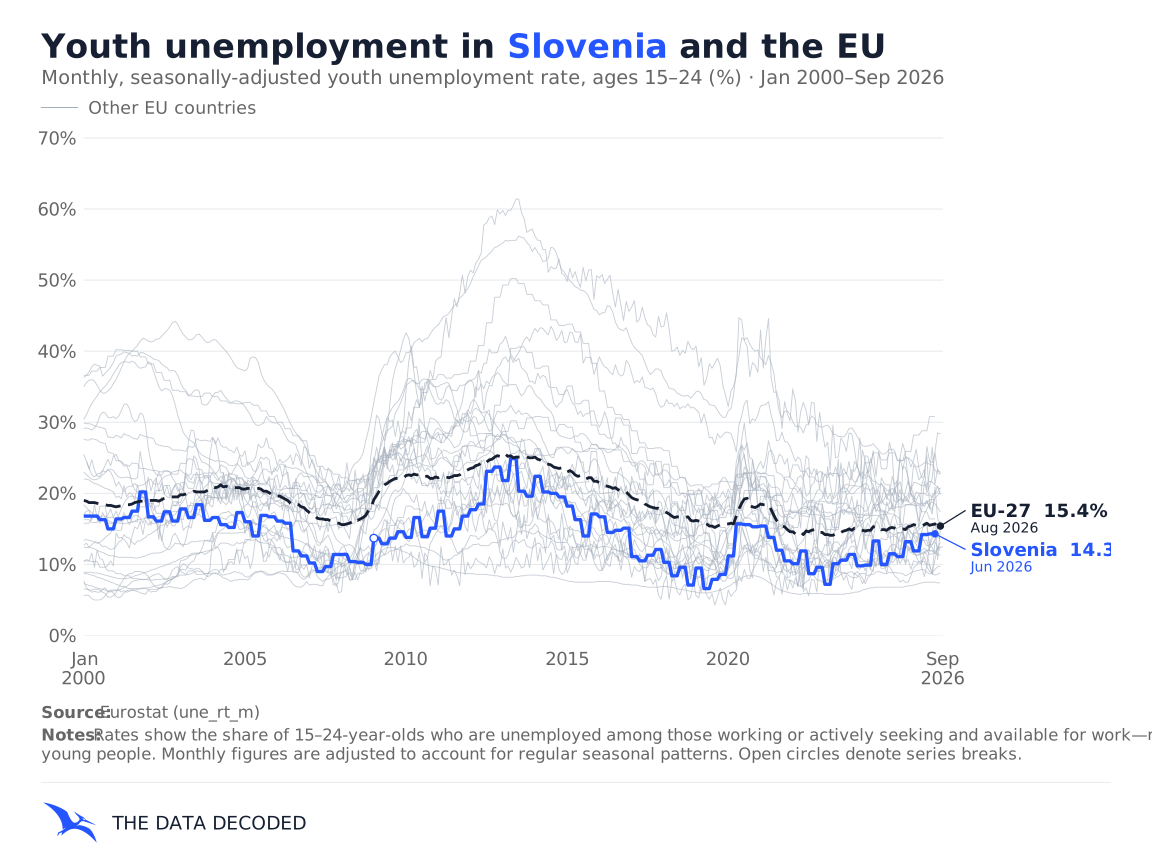
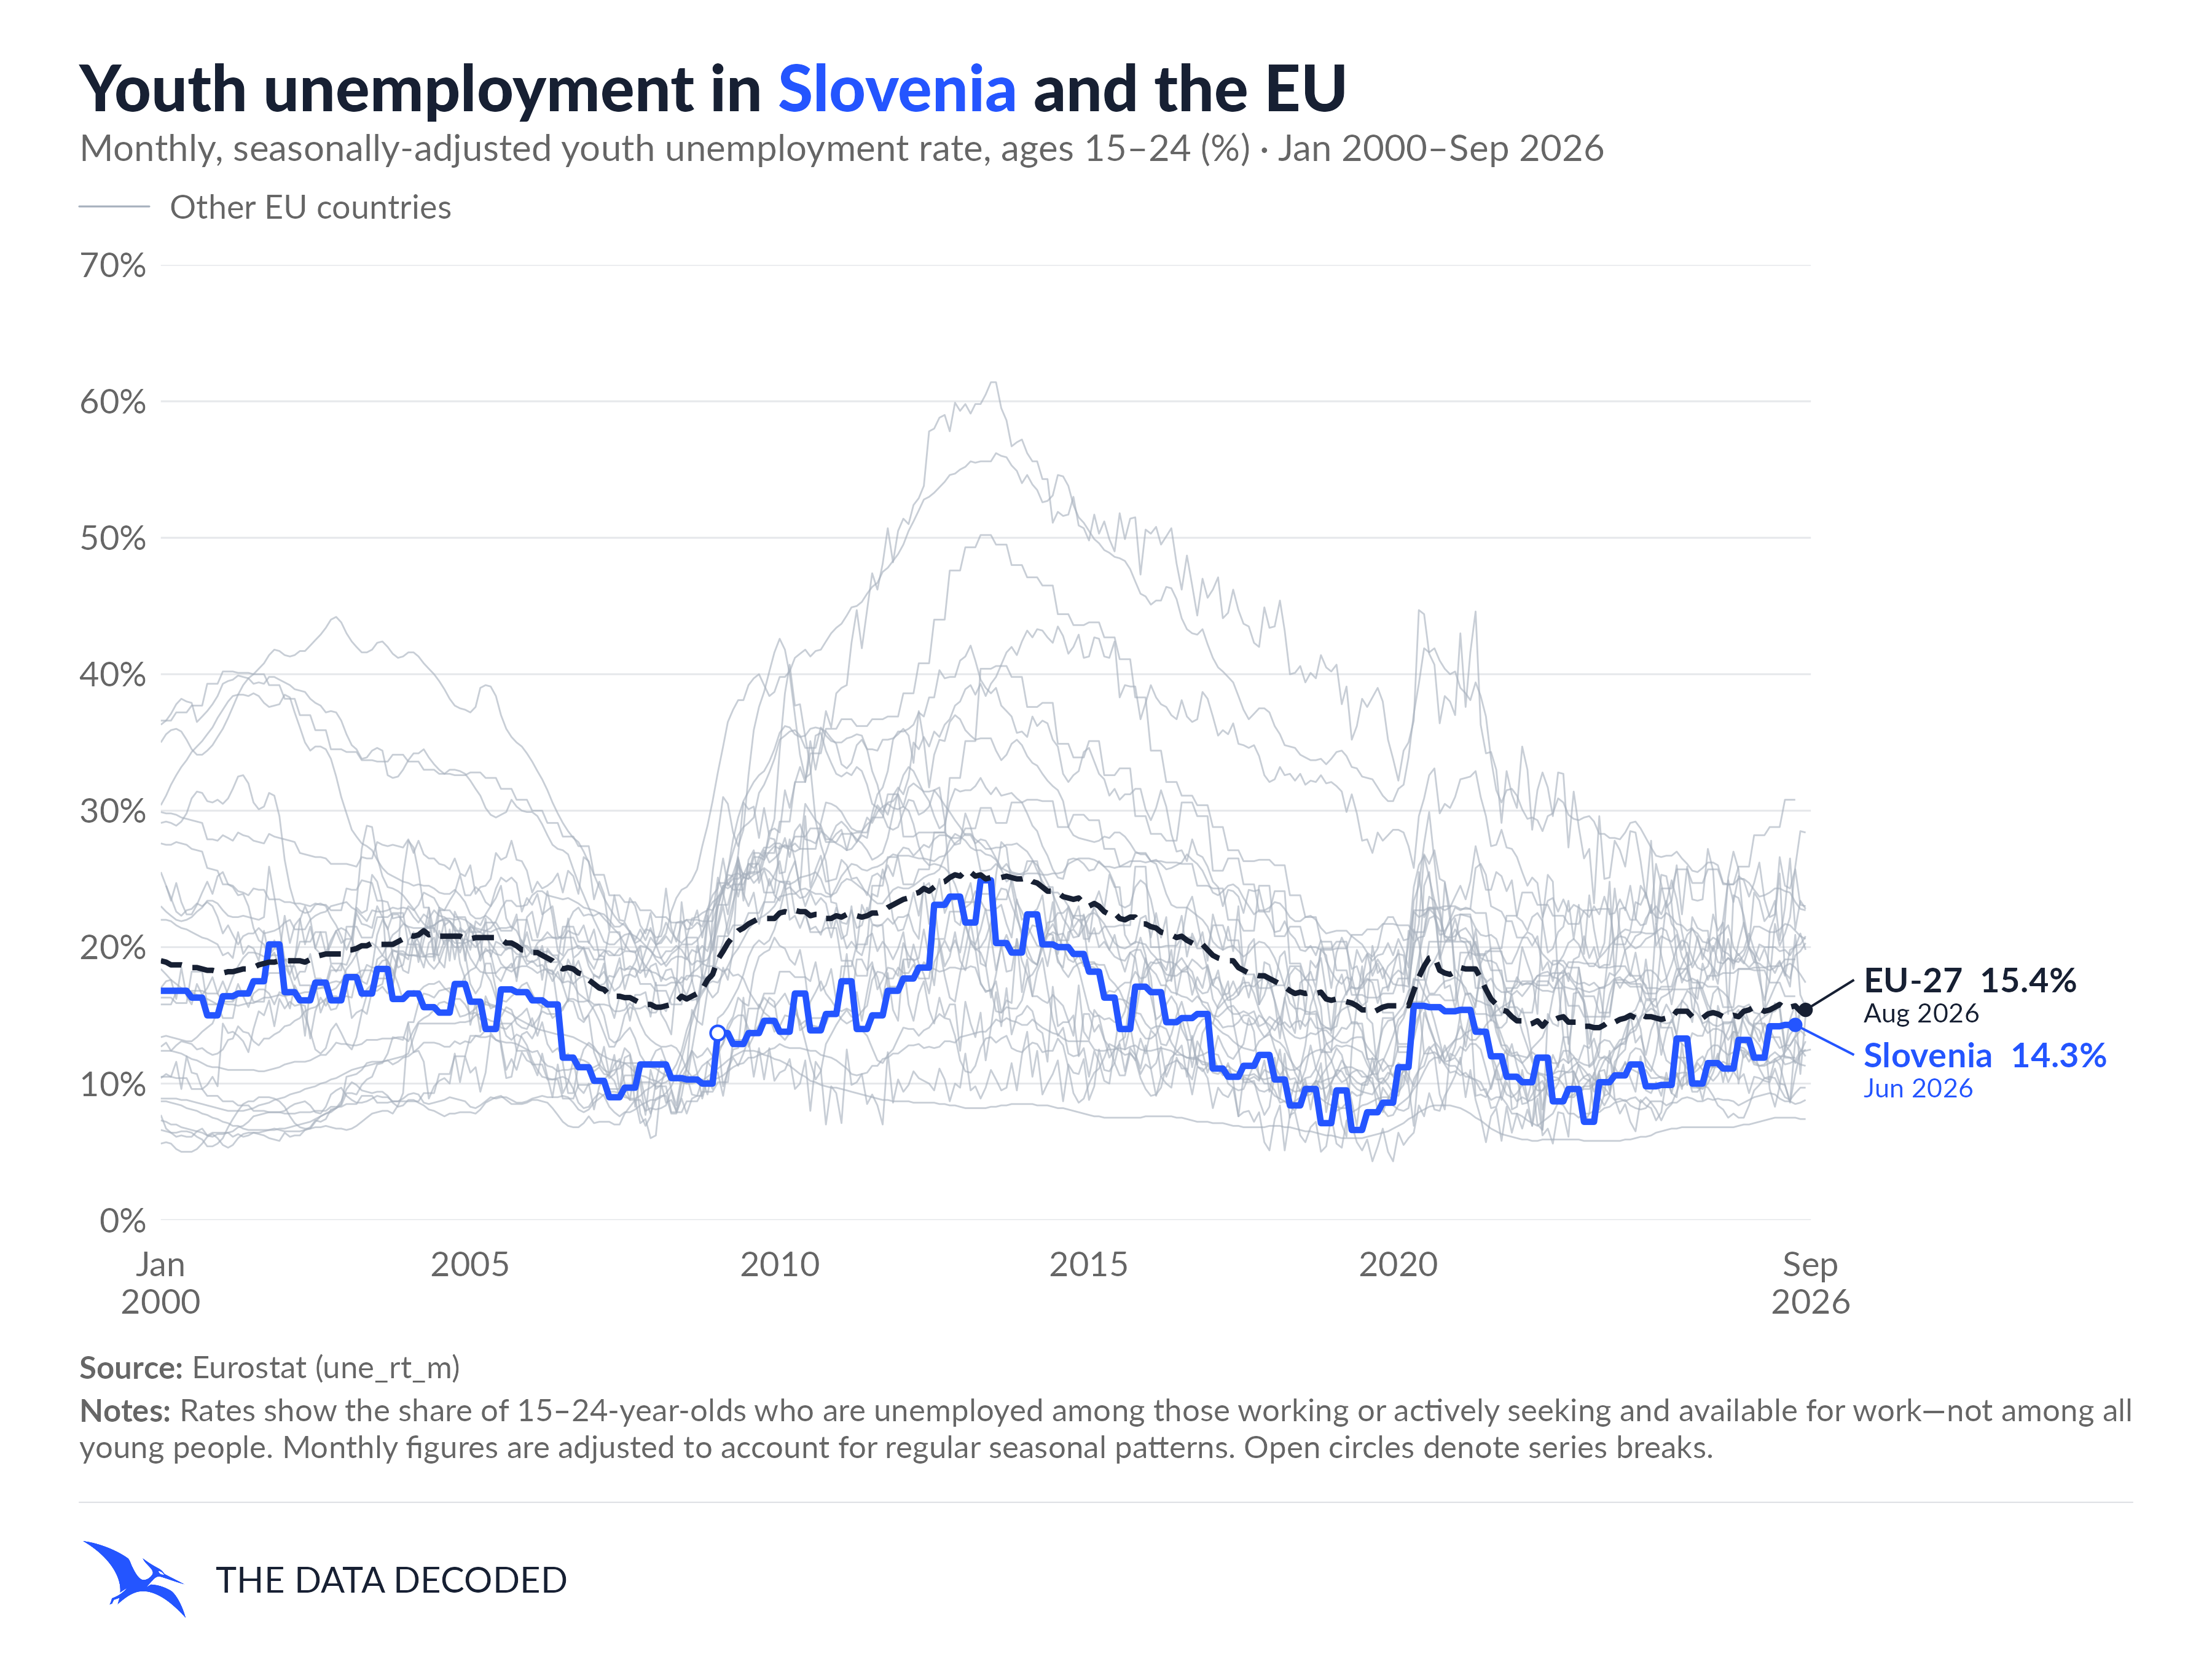
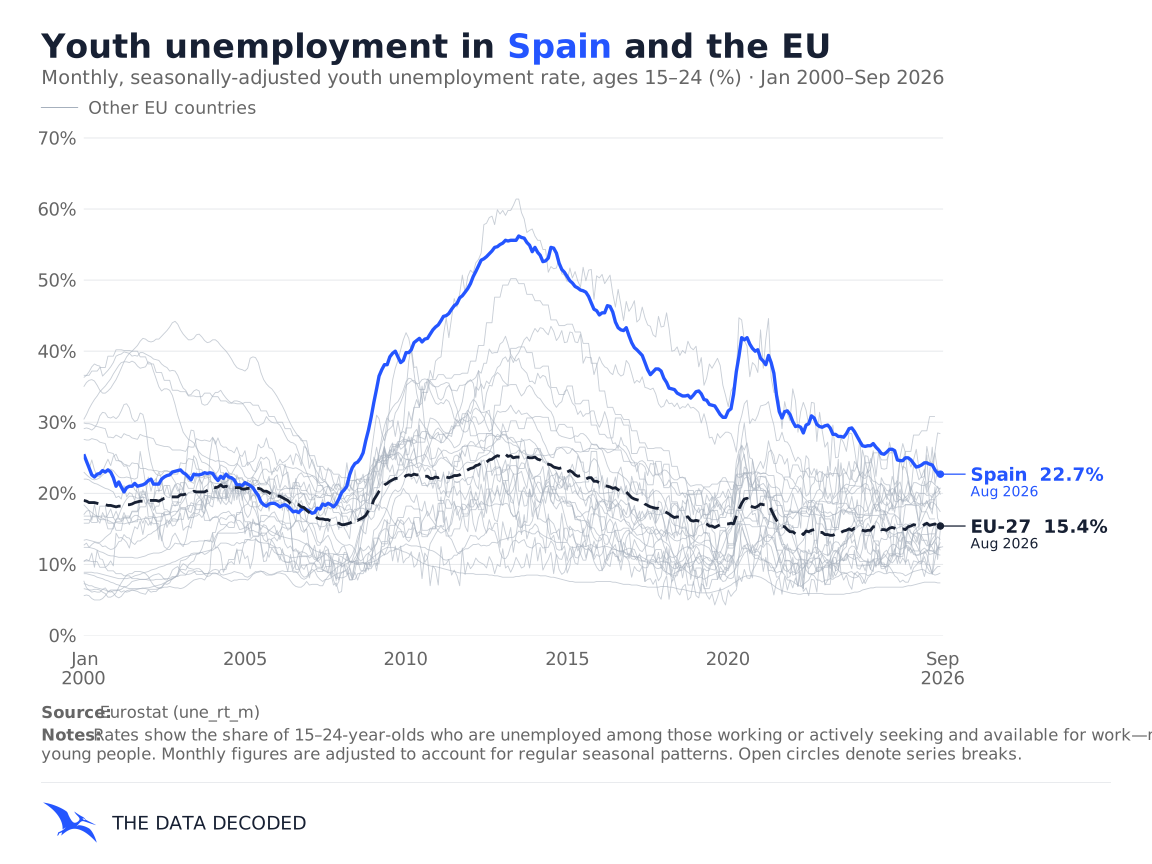
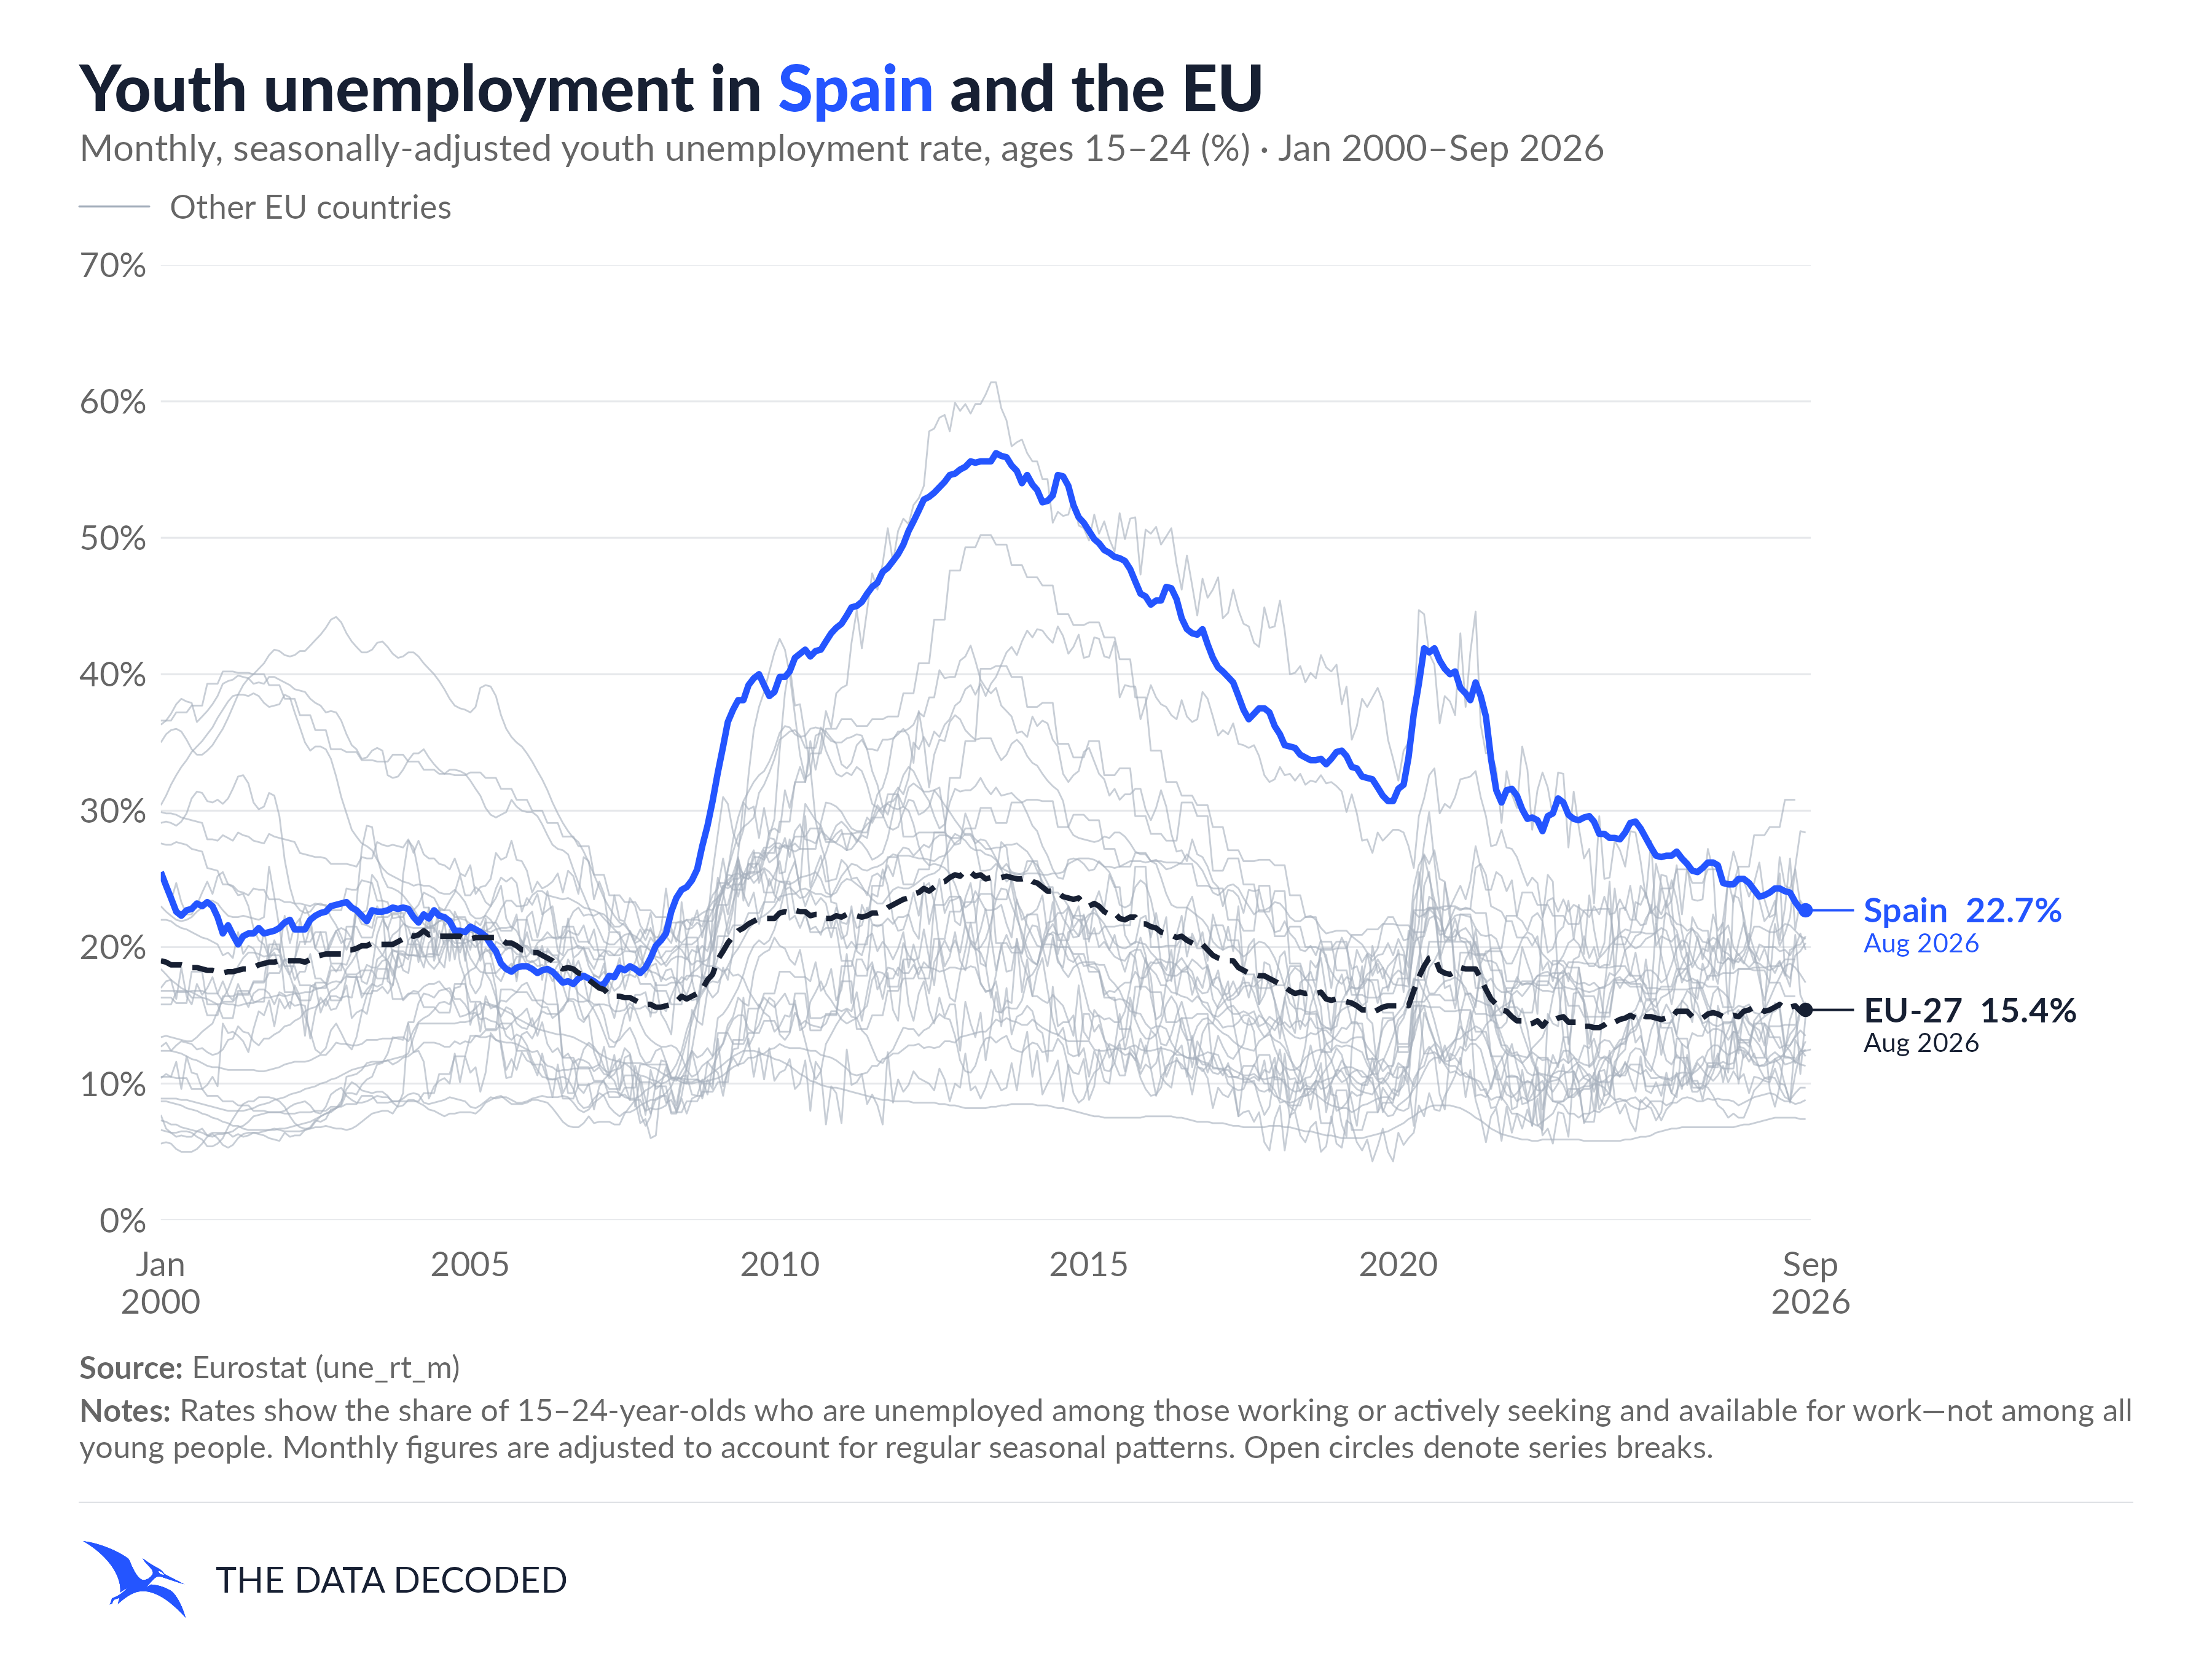
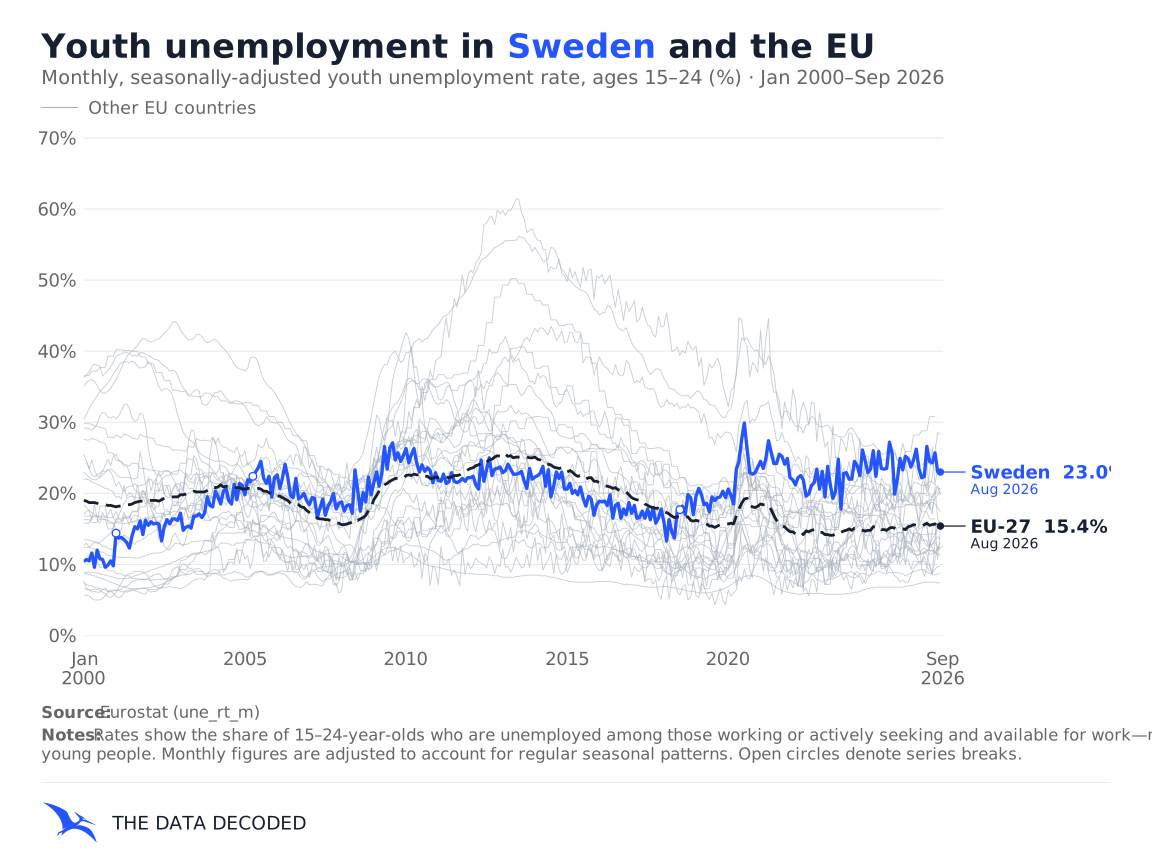
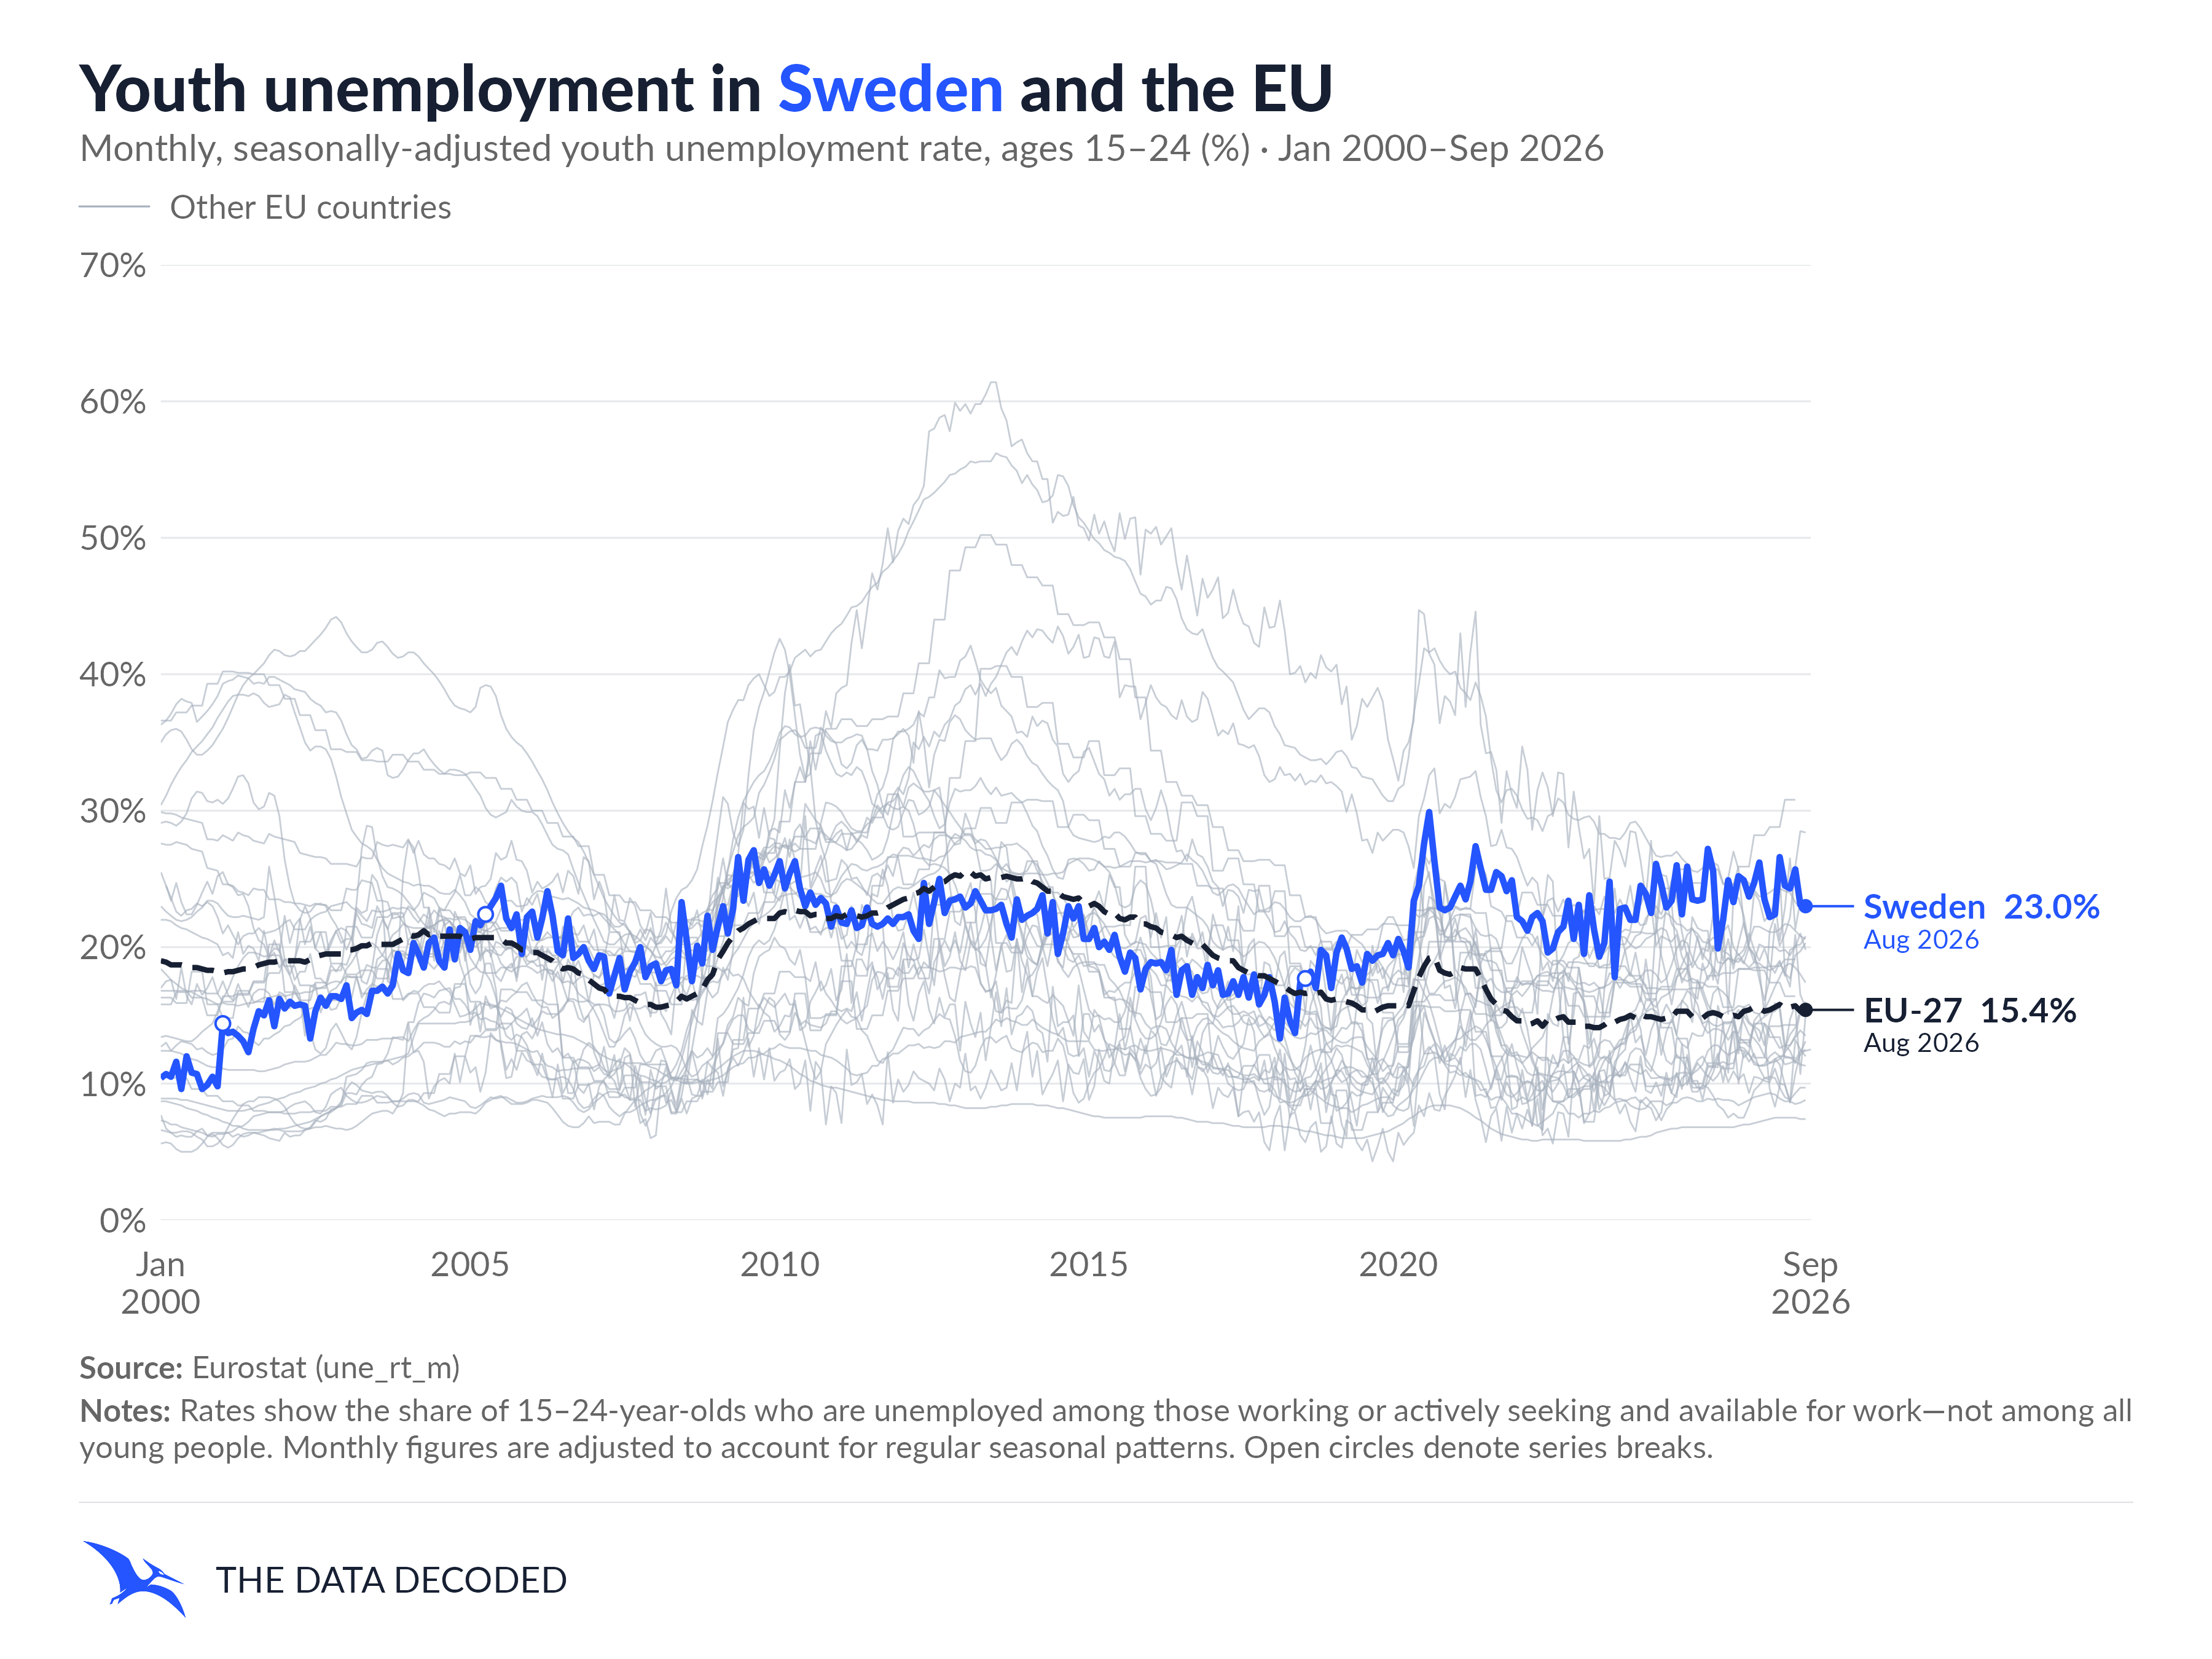
The charts trace youth unemployment in every current EU member state since 2000. Select a country to compare its monthly path with the published EU-27 aggregate and the other 26 members. Every country uses the same colours, chart size and axes, so changing the selection changes the focus while preserving the comparison.
The rate measures unemployed 15–24-year-olds in the labour force: those working or actively seeking and available for work. Young people outside the labour force, including many students, are excluded from the denominator. It is not the percentage of all young people who are unemployed.
Explore your country
Choose from all 27 current EU members. Every chart uses the same axes and compares the selected country with the published EU-27 aggregate.
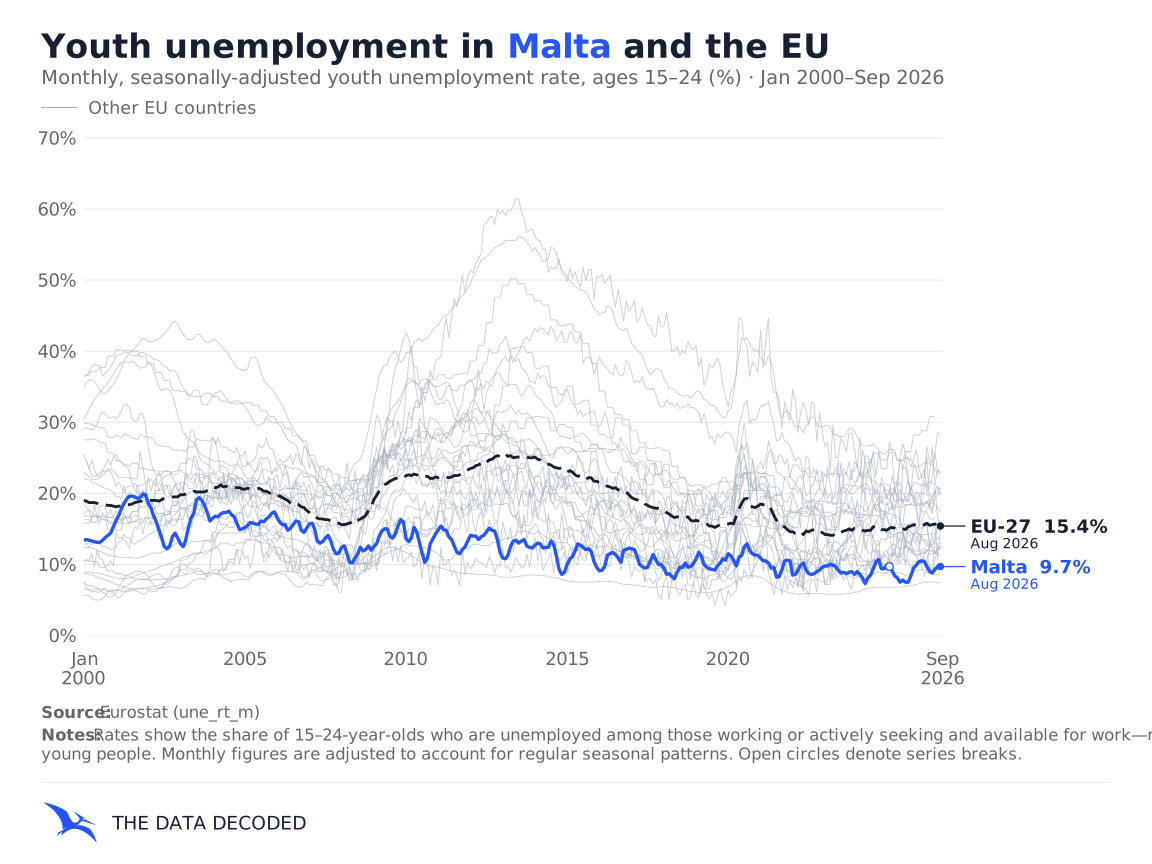
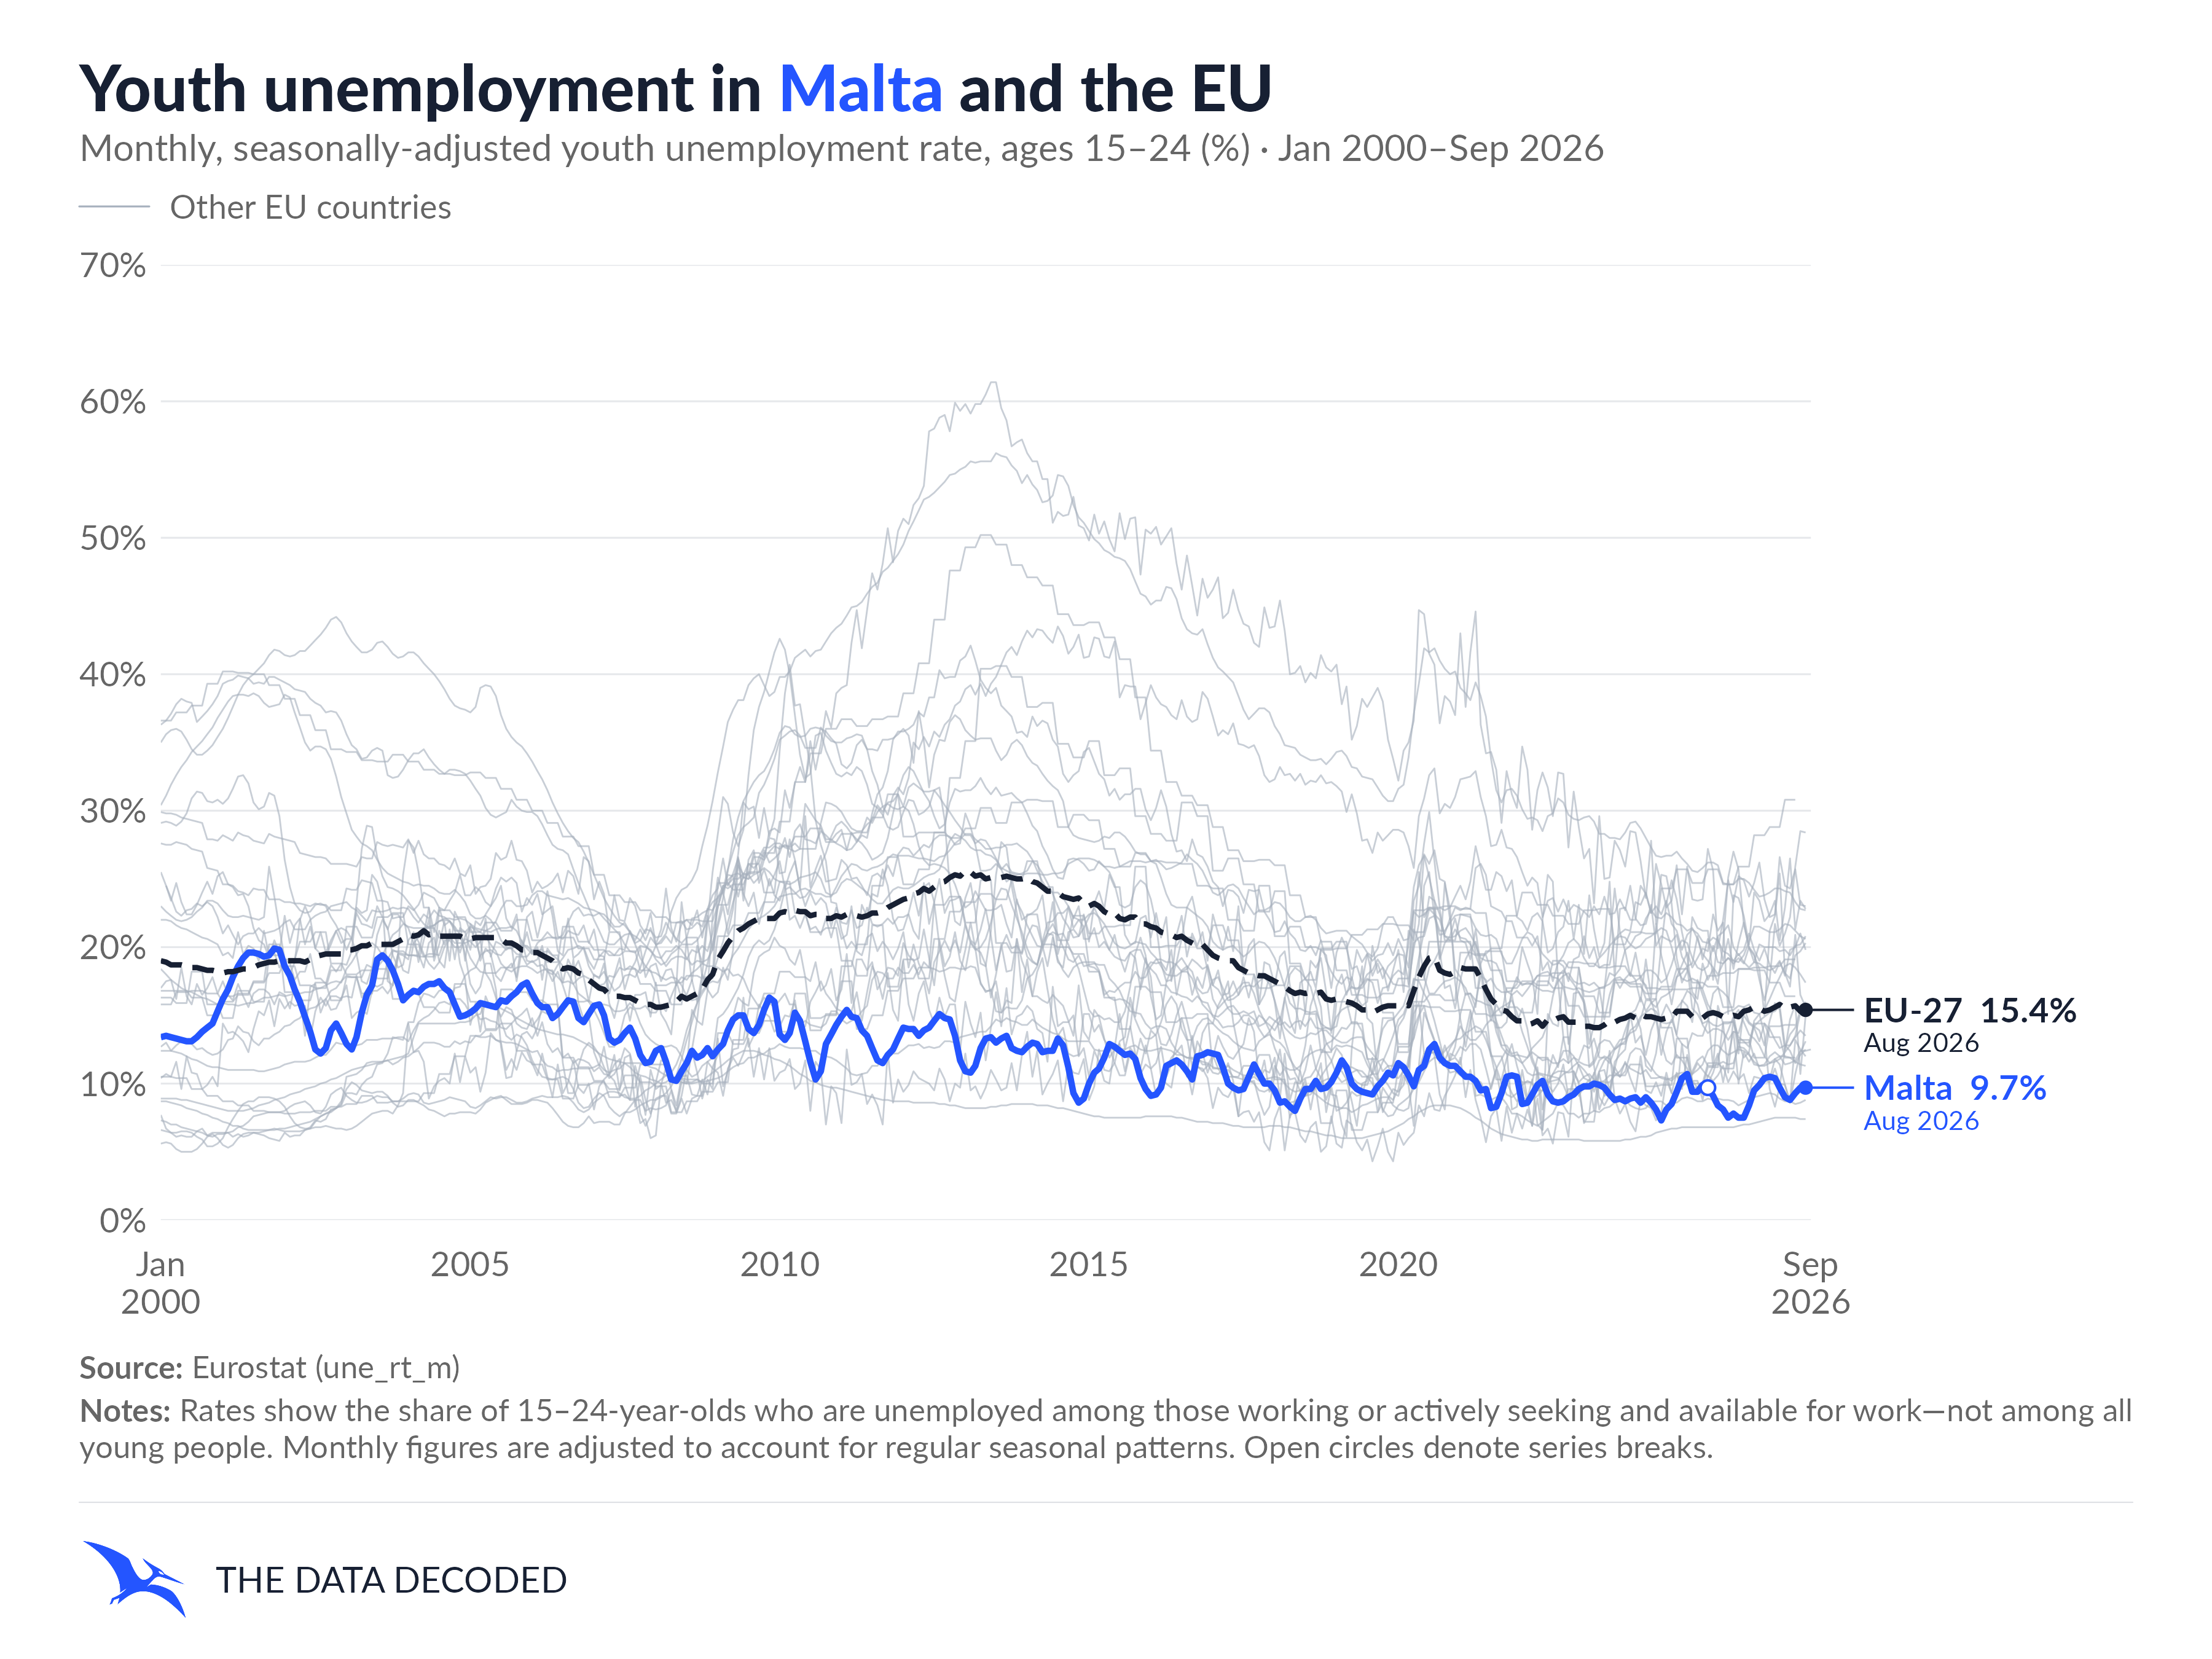
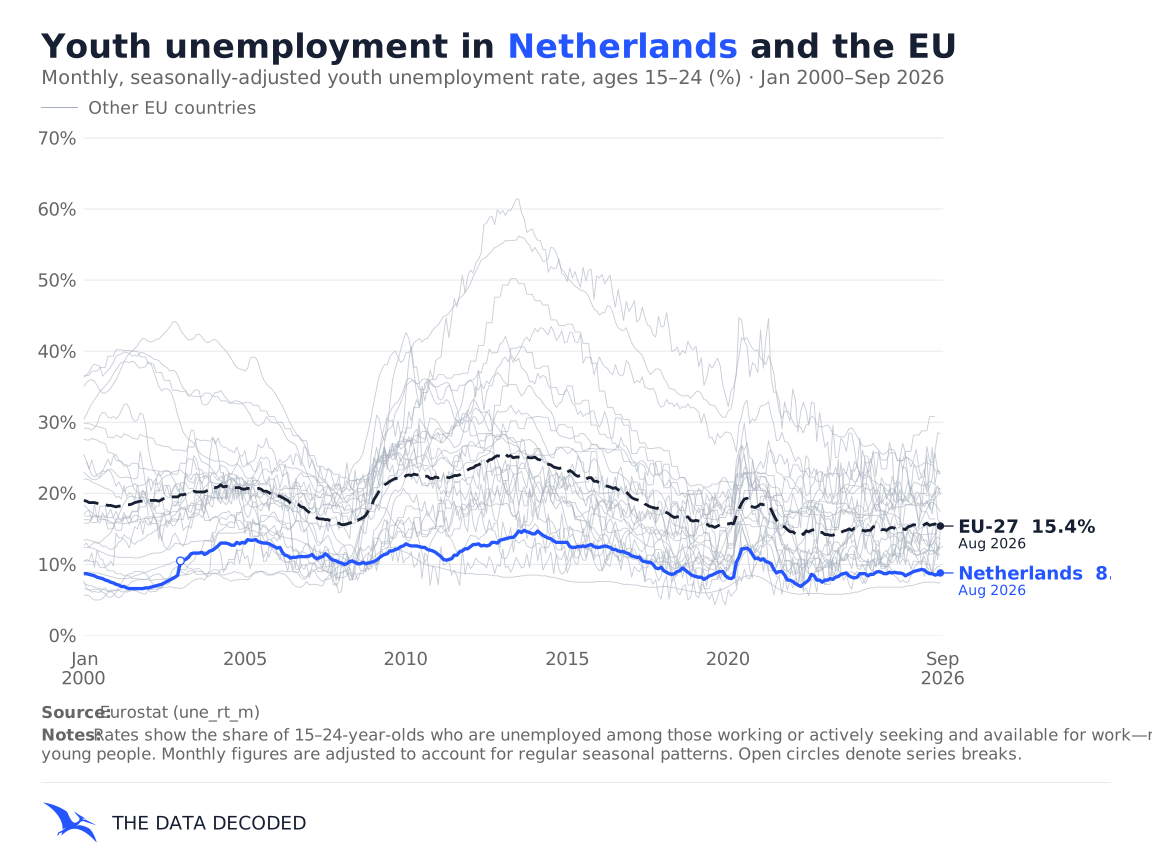
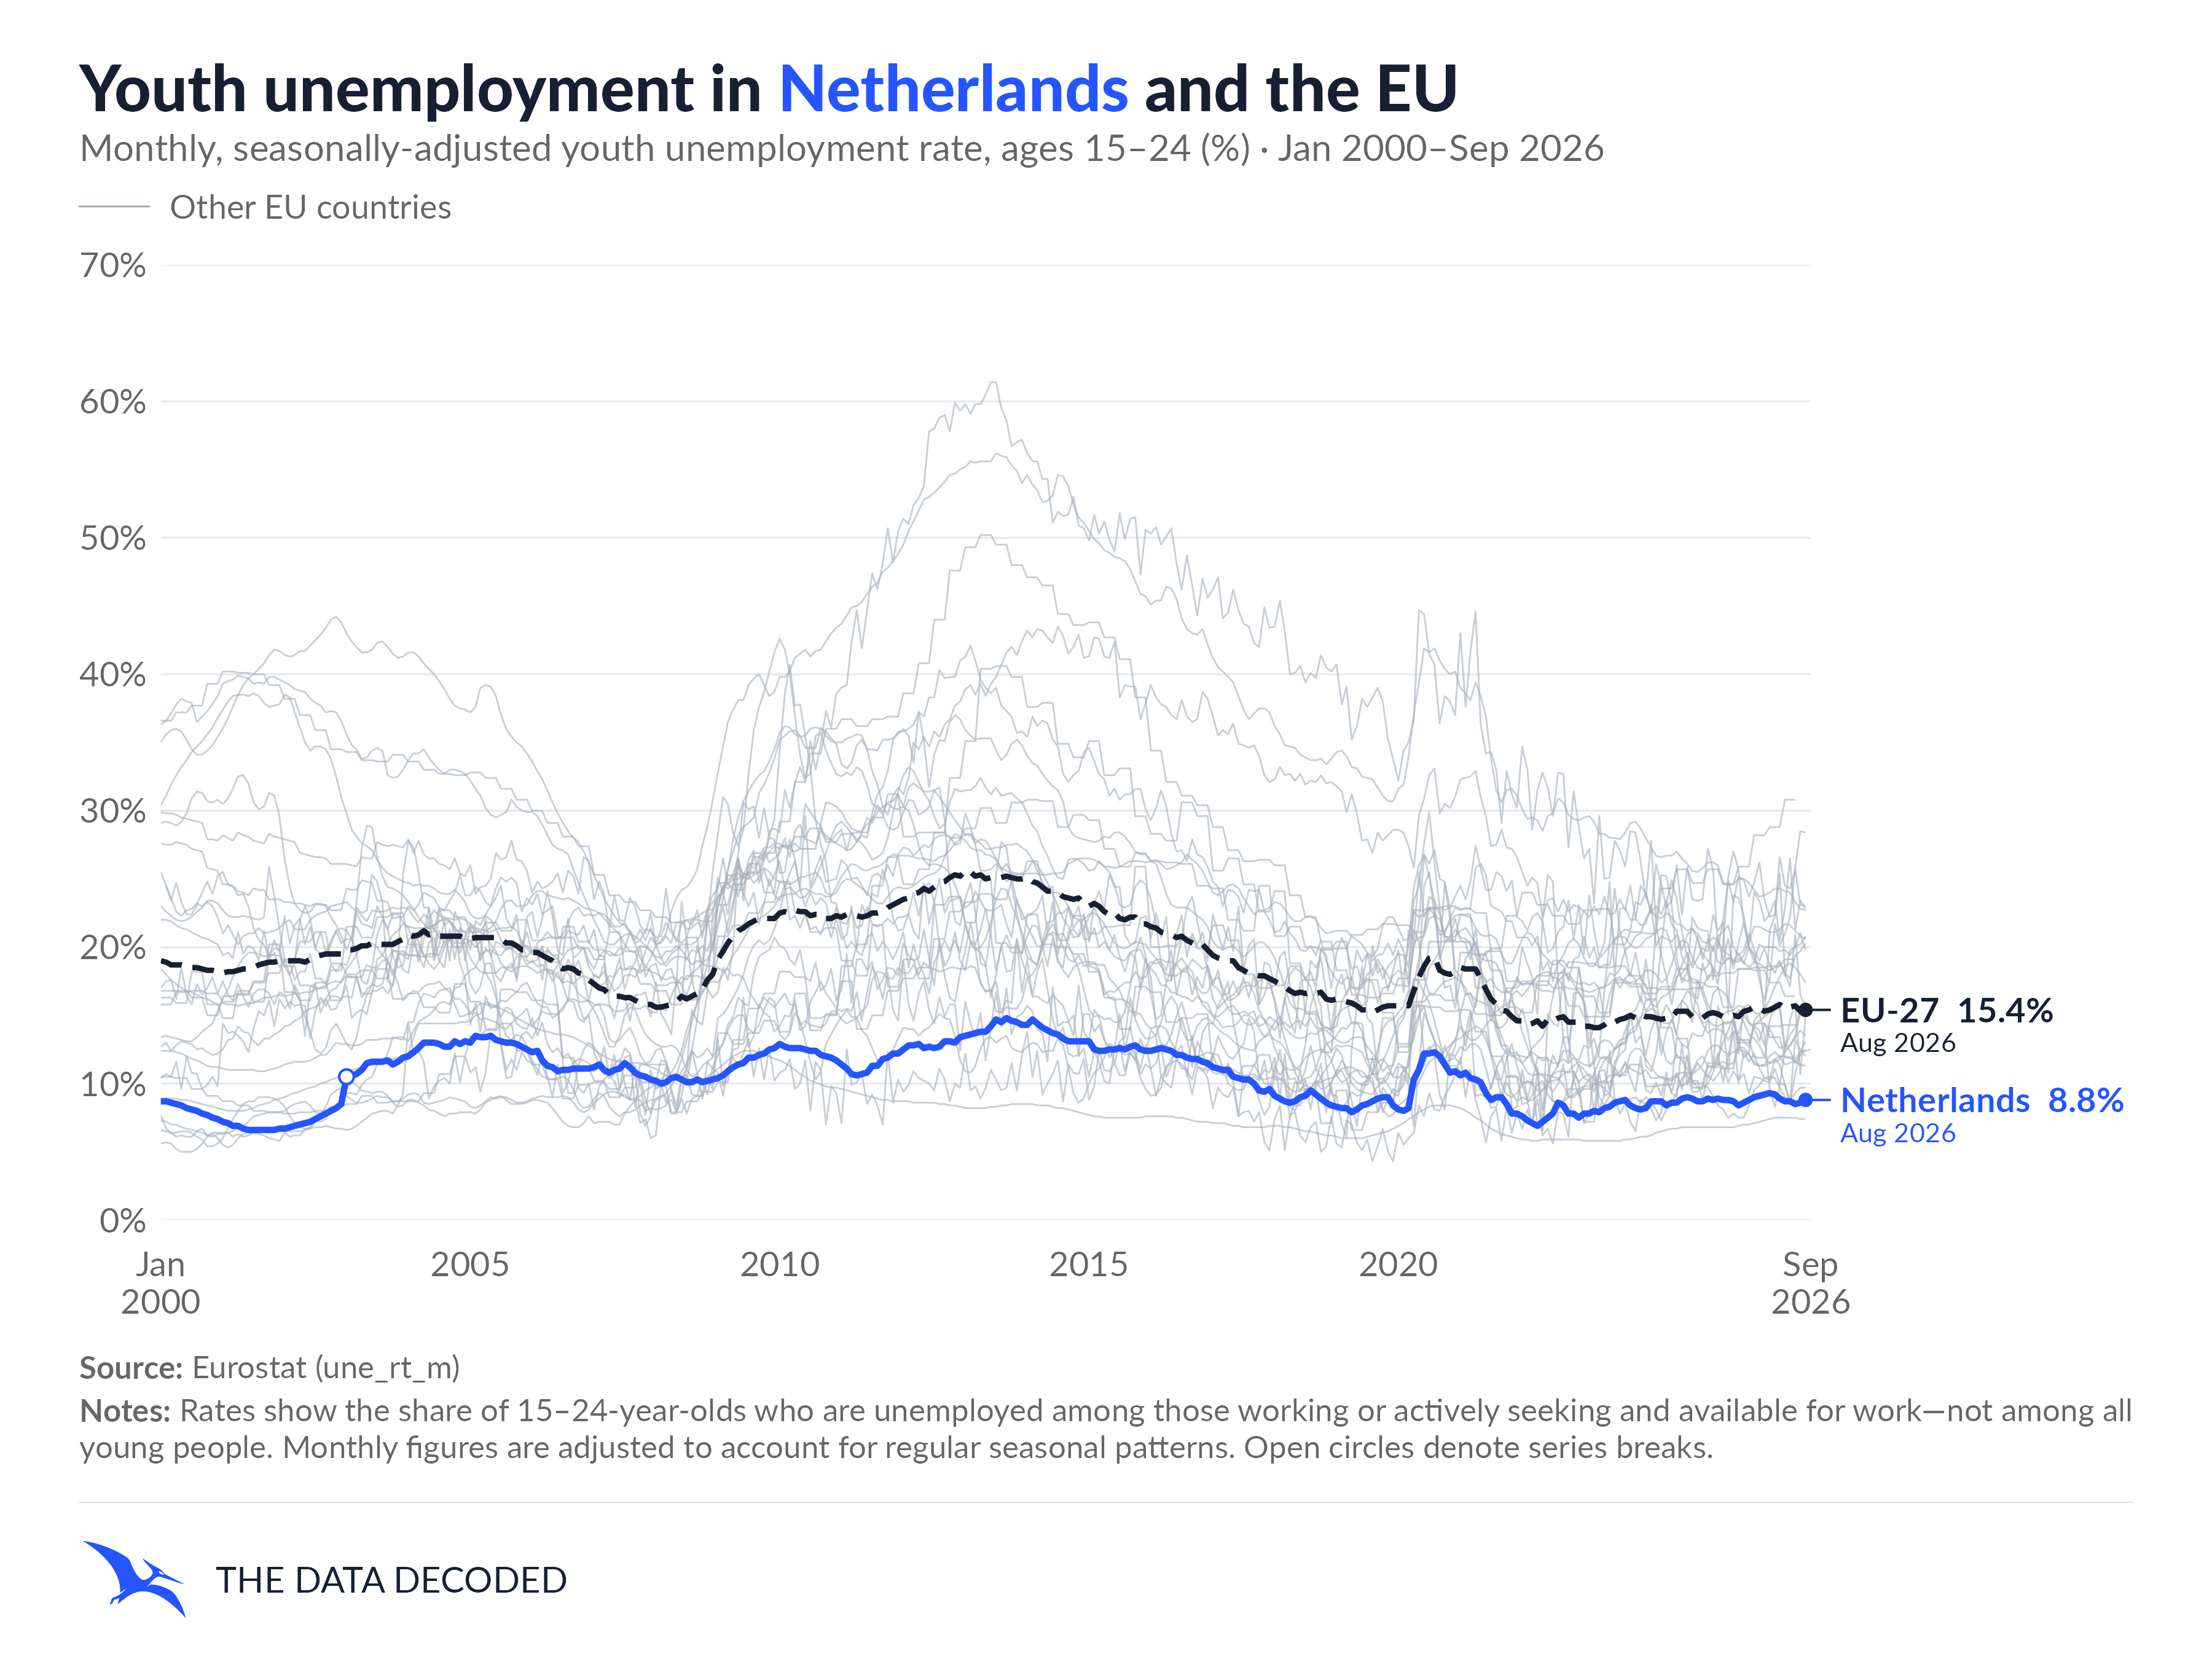
Downloads for all 27 countries
PNG: 3,600 × 2,700 pixels at 300 dpi. SVG: scalable vector geometry with editable text.
| Country | PNG | SVG |
|---|---|---|
| Austria | PNG | SVG |
| Belgium | PNG | SVG |
| Bulgaria | PNG | SVG |
| Croatia | PNG | SVG |
| Cyprus | PNG | SVG |
| Czechia | PNG | SVG |
| Denmark | PNG | SVG |
| Estonia | PNG | SVG |
| Finland | PNG | SVG |
| France | PNG | SVG |
| Germany | PNG | SVG |
| Greece | PNG | SVG |
| Hungary | PNG | SVG |
| Ireland | PNG | SVG |
| Italy | PNG | SVG |
| Latvia | PNG | SVG |
| Lithuania | PNG | SVG |
| Luxembourg | PNG | SVG |
| Malta | PNG | SVG |
| Netherlands | PNG | SVG |
| Poland | PNG | SVG |
| Portugal | PNG | SVG |
| Romania | PNG | SVG |
| Slovakia | PNG | SVG |
| Slovenia | PNG | SVG |
| Spain | PNG | SVG |
| Sweden | PNG | SVG |
Interpretation
Reading the country charts
The selected country is blue, the EU-27 aggregate is dark and dashed, and the other current members are grey. All charts span January 2000–September 2026 and use the same 0–70% vertical scale. Each line stops at its own latest available observation; the two direct labels show the final value and its date. Open circles identify flagged breaks on the selected country's series.
Use the shared axes to compare levels, peaks and changes over time. A country's distance from the EU line describes a difference in unemployment rates; it does not explain its causes. The charts show Eurostat's actual monthly cells without additional smoothing or moving averages.
The latest observations do not all refer to the same month
This saved data vintage ends in September 2026 for Ireland, August 2026 for 21 other countries and the EU-27 aggregate, and June 2026 for Belgium, Croatia, Cyprus, Romania and Slovenia. Compare dates as well as values, especially when examining the latest endpoint. All available history before a country's EU accession is retained; “EU countries” refers to today's membership throughout.
Sources and methodology
Source, period and definition
Data were retrieved directly from Eurostat's official API on 9 October 2026, from dataset une_rt_m. The saved response reports its update as 8 October 2026, 11:00 +02:00. This article presents that preserved vintage, not a live feed.
The filters are monthly (M), under 25 (Y_LT25, corresponding here to ages 15–24), both sexes (T), percentage of the labour force (PC_ACT), and seasonally adjusted (SA). Codes were checked against the JSON-stat structural metadata and official SDMX data structure and code lists. Seasonal adjustment accounts for regular seasonal patterns; it does not remove every source of short-term variation.
The scope is all 27 current EU members plus the published fixed-composition EU27_2020 aggregate, from January 2000 onward. The EU line is Eurostat's published series, never an unweighted average of national rates. Every country-month and observation flag is retained. Missing values remain gaps: there is no TDD interpolation, backfilling, extrapolation or extra smoothing.
Coverage and quarterly-based series
Across 28 series and 321 requested months, the saved selection contains 8,950 numeric observations and 38 missing cells: one leading cell and 37 trailing cells, with no internal gaps. Estonia starts in February 2000; all other series start in January 2000. The latest month comes from the observations themselves.
Eurostat's dataset footnotes label the under-25 series for Belgium, Croatia, Cyprus, Romania and Slovenia as “Quarterly data”. They appear in the monthly table, but their monthly cells should not be read as independently observed monthly survey results. The charts use the available cells exactly as supplied, without creating additional monthly estimates. Their final available observations in this vintage are June 2026.
Breaks, flags and revisions
The source reference metadata and footnote workbook are preserved with the data. The selection includes:
b— break in time series: 21 flagged observations across 18 country series. Survey or methodological changes can affect comparability across a flagged date. Open circles mark these observations on the selected country's line.d— definition differs: retained at the observations where Eurostat places the flag. Consult the source qualifications before making strict comparisons; the flag does not imply a separately measured correction.u— low reliability: Luxembourg's July, August and September 2014 observations are flagged.
No selected observations have explicit estimated (e) or provisional (p) flags. This does not mean every value is a direct monthly survey observation or is immune to revision. Eurostat combines labour-force survey information with country-specific indicators and estimation methods.
Germany and the Netherlands supply trend estimates within the requested seasonally adjusted selection, according to Eurostat's metadata. These provider series are retained as published. Their treatment, the quarterly basis of five youth series and differences in national estimation methods limit strict month-to-month comparisons.
Historical values may change after revised seasonal adjustment, updated labour-force survey estimates, census weights or method changes. The preserved metadata documents, among other examples, Germany's revisions back to 2009, Spain's census-based revisions for 2021–2023, and France's revision back to 2003 to include Mayotte, published on 1 October 2026. Break-adjusted histories can remove some earlier discontinuities, while remaining flags and provider qualifications still matter. A later Eurostat vintage may therefore differ from these charts.
Validation and reproduction
The project files on GitHub contain the raw responses, retrieval URLs and timestamps, tidy observations, every country's coverage and missing cells, flags, break dates and reproducible R/ggplot2 code. The retrieval and plotting pipeline verifies the saved sources by SHA-256; TDD_REFRESH=1 retrieves a new vintage.
All plotted line coordinates were checked against the tidy dataset. Five observations were also independently decoded from a separate official SDMX TSV delivery and matched to the JSON-stat response, including flags. This checks delivery formats and parsing, not an independent survey estimate. PNGs and SVGs were checked for layout, readable text, endpoint labels and branding.
Each country has a 3,600 × 2,700 PNG at 300 dpi and an SVG with editable text and embedded Lato font subsets. SVGs retain vector geometry for zooming; desktop editors that ignore embedded fonts require local Lato. Both download formats use the same validated data and chart layout.