
China's industrial rise fueled Australia's resource boom as its economic complexity ranking fell.
China’s industrialization fueled demand for Australian resources as their economic complexity rankings diverged. Vietnam and the Philippines also overtook Australia.
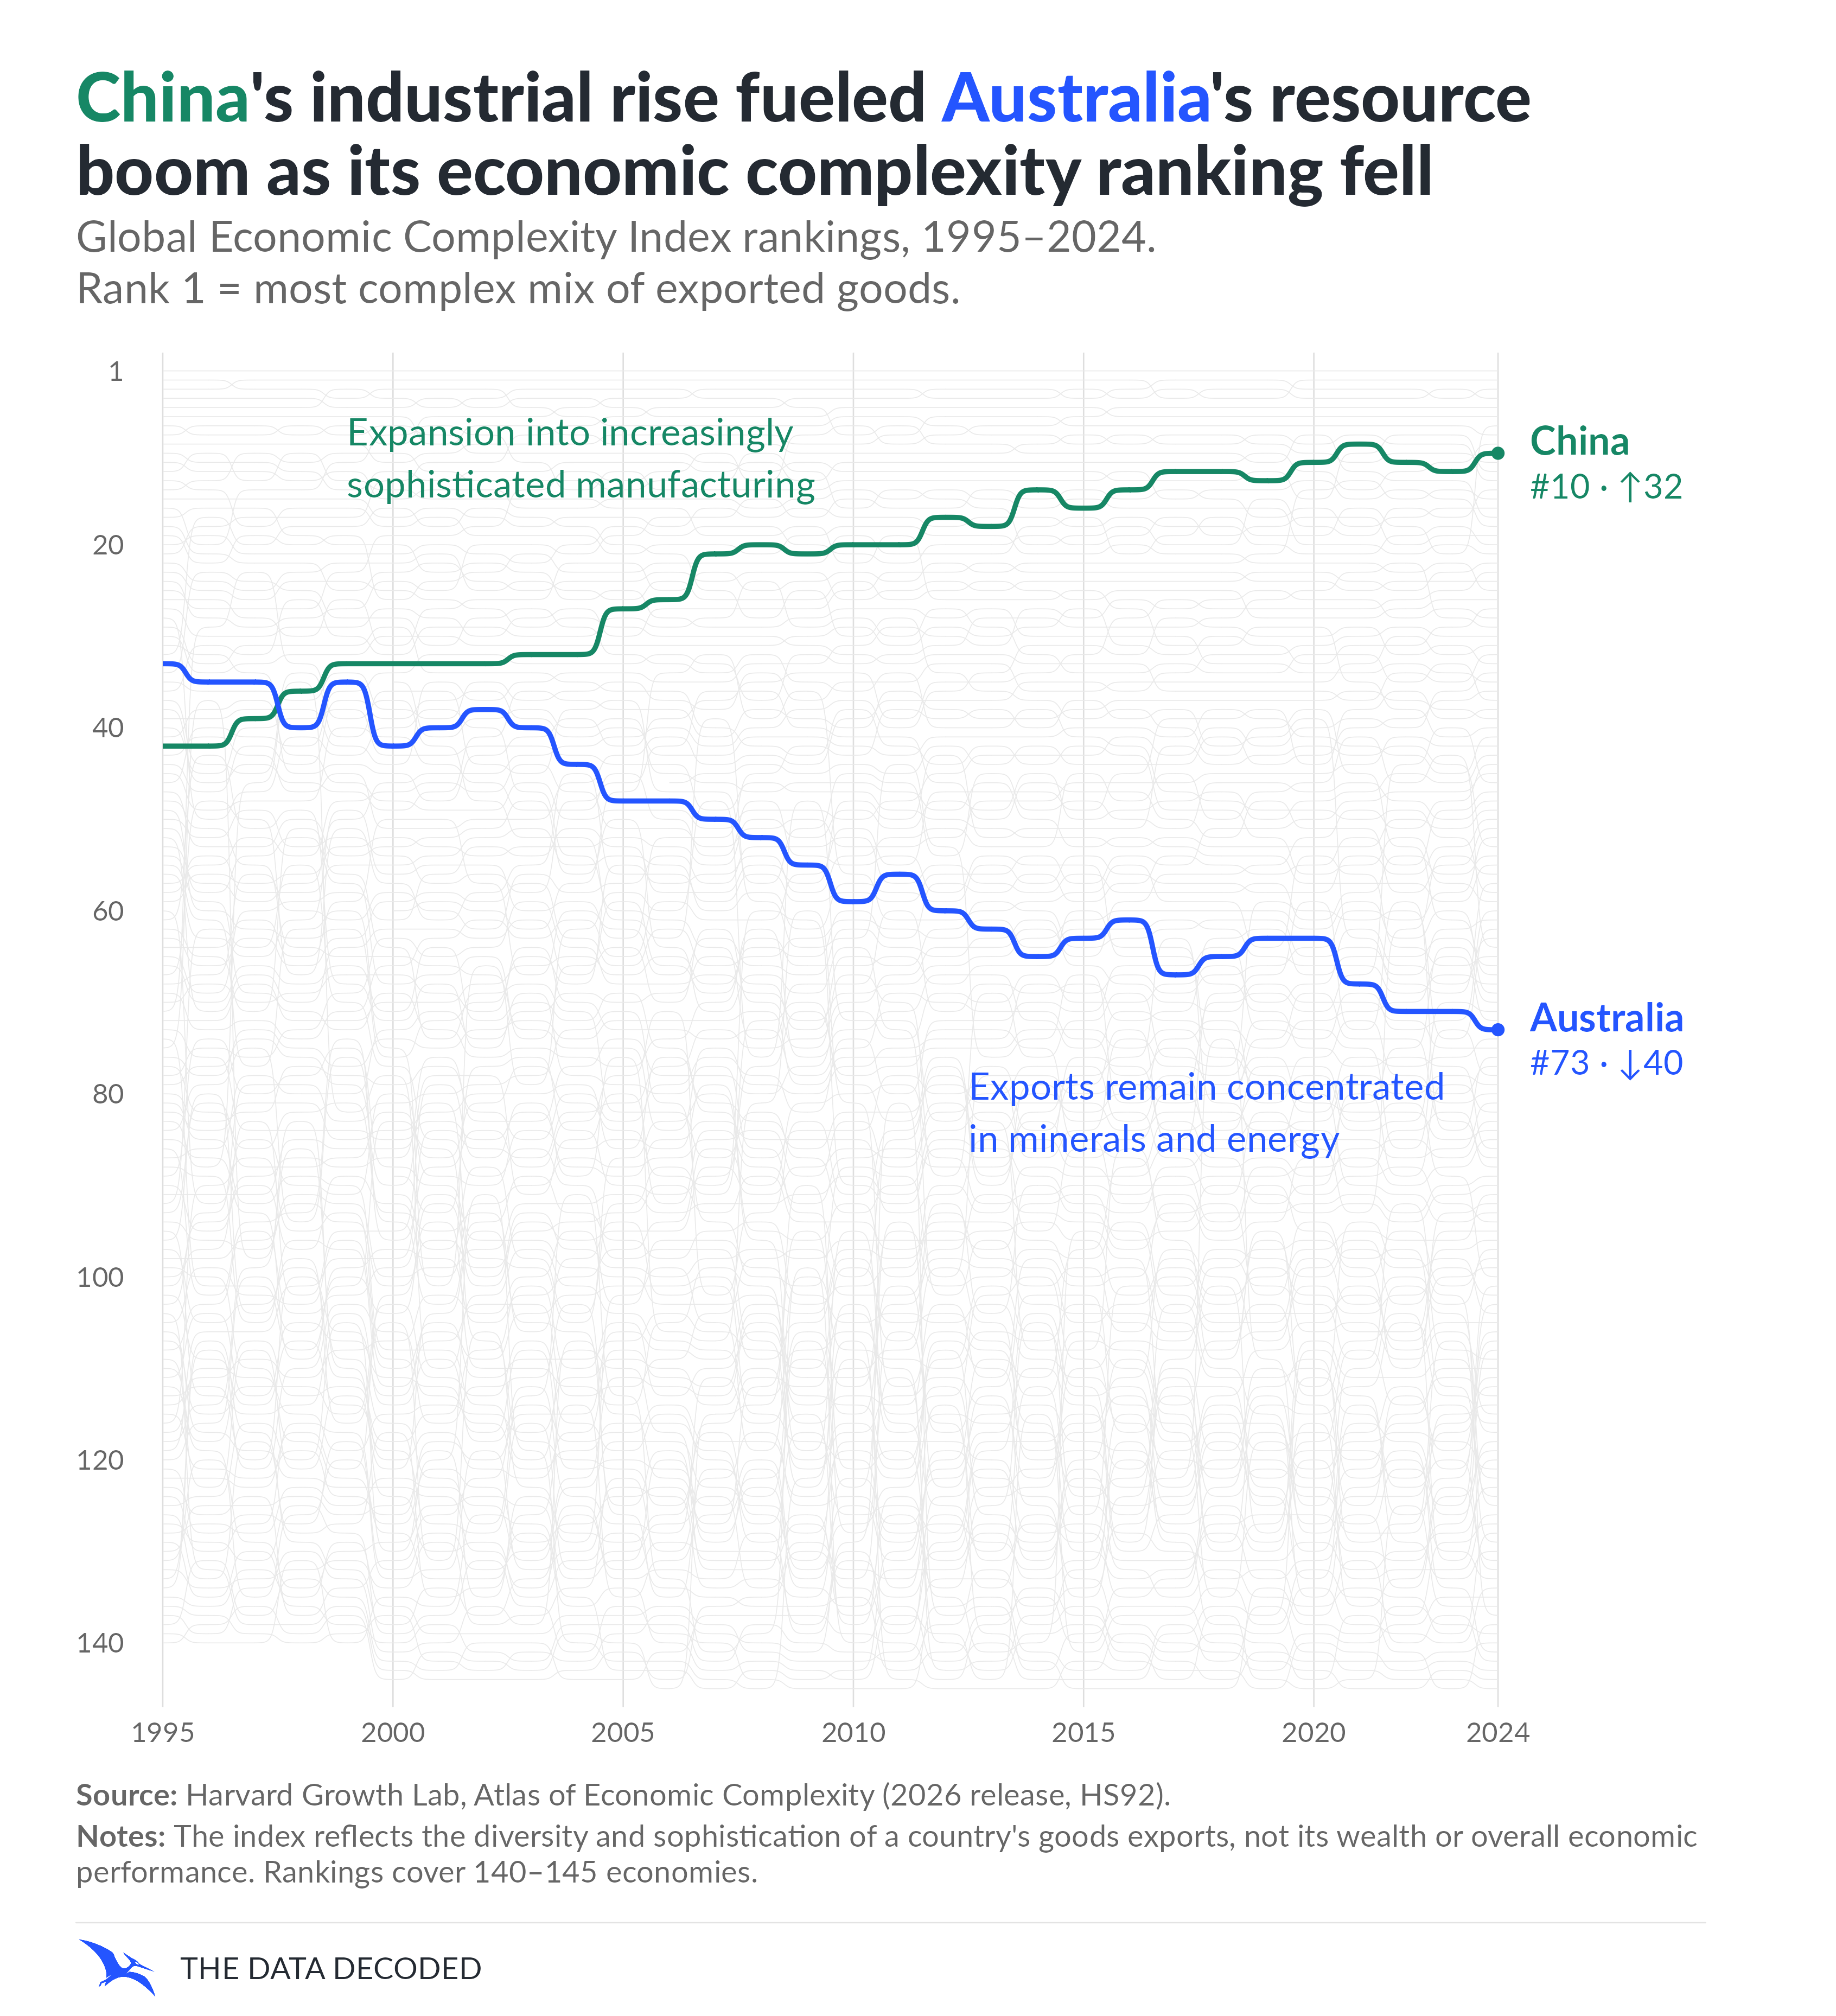
China’s industrialization reshaped the trade relationship with Australia. As China’s manufacturing and construction expanded, demand for Australian iron ore and coal rose. That demand helped fuel Australia’s mining boom and reinforced its specialization in natural resources, as Reserve Bank of Australia research describes.
The countries’ economic complexity rankings moved in opposite directions. From 1995 to 2024, China climbed from 42nd to 10th while Australia moved from 33rd to 73rd. China’s goods exports shifted toward increasingly sophisticated manufacturing. In Australia, the value of resource exports rose from 35% of total exports in 2000 to 55% in 2010, according to the Reserve Bank of Australia. The same industrial transformation that increased Chinese demand for Australian resources therefore contributed to the forces behind the divergence in their export profiles. The charts show the relative rankings; they do not isolate how much of Australia’s rank change this trade relationship caused.
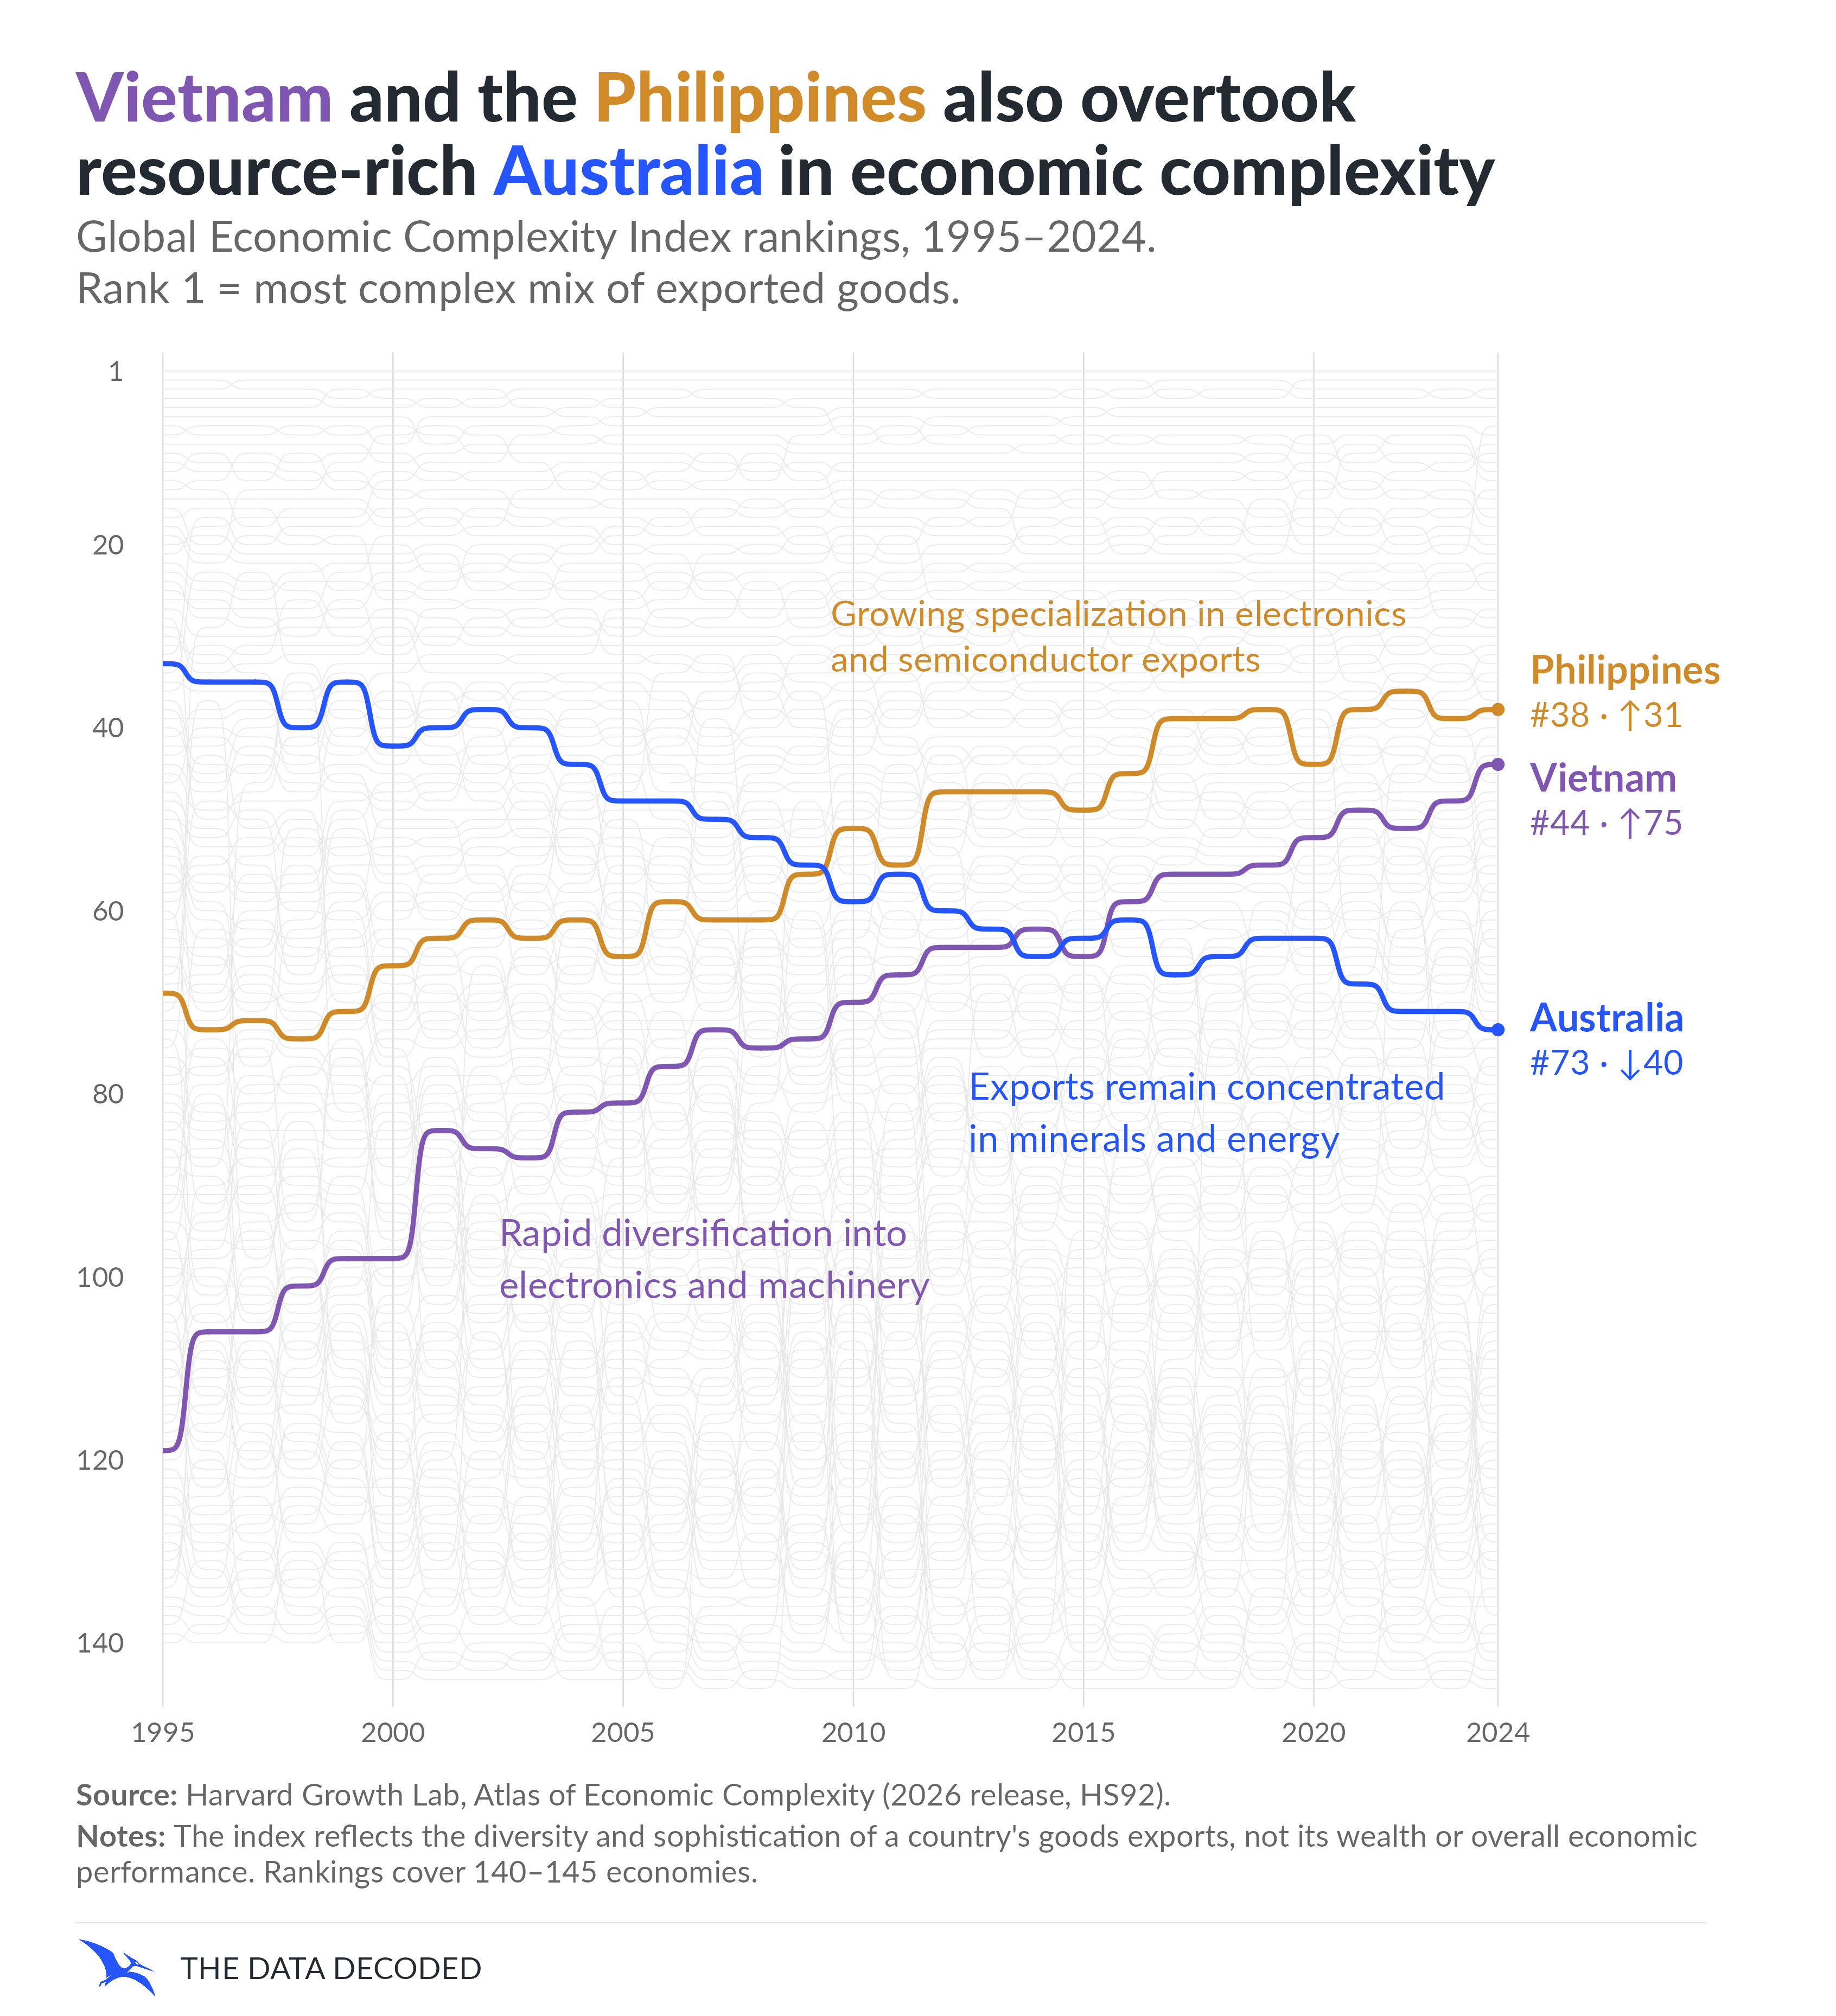
China was not alone in overtaking Australia. Vietnam rose from 119th to 44th and the Philippines from 69th to 38th. Both expanded their participation in electronics and manufacturing supply chains, part of a broader shift in Asian exports. The World Bank documents Vietnam’s diversification into electronics and machinery; Philippine Statistics Authority data show the importance of electronics and semiconductors in Philippine goods exports.
The first chart highlights China and Australia; the second highlights Australia, Vietnam and the Philippines. Both show all 145 economies where observations exist. Economic complexity measures the diversity and sophistication of goods exports, not national wealth. A rank also depends on how other economies perform, so a lower position does not by itself measure an absolute decline in a country’s capabilities.
Sources and methodology
Use the official Harvard Growth Lab Growth Projections and Complexity Rankings dataset, version 12.0, released February 8, 2026 and accessed October 12, 2026. Every year uses the same HS92 classification and historical vintage. Original global ranks are preserved. All 4,319 ranked country-year values match the Nations Inquiry compilation, which provides display names. There is no background sampling or recalculation of ranks.
Each highlighted country has 30 annual observations. Ranked coverage is 140 economies in 1995–1999, 144 in 2000–2005, and 145 from 2006 onward. Economies are drawn only where observations exist; missing ranks are not filled and series are split at gaps. Curves connect annual observations, not independently measured continuous rankings. Rounded scores can tie; the supplied published ranks are unique. The Dataverse descriptive coverage field ends at 2023, while the actual version 12.0 CSV includes 2024.
For the resource-boom context, see the Reserve Bank of Australia’s analysis of China’s industrialisation and Australian resource demand and its study of the mining industry. The contextual annotations draw on the World Bank's Viet Nam 2045: Trading Up in a Changing World and Viet Nam export-diversification discussion, Harvard Kennedy School's discussion of increasingly sophisticated Chinese manufacturing, and Australia's Department of Foreign Affairs and Trade 2024 leading exports table. These are context, not a decomposition or causal explanation of ECI changes.
Ranks and normalized scores are relative. Coverage, classification concordances, reporting differences, revisions, gross export composition, and inclusion thresholds can affect them. Export sophistication does not directly measure domestic value added or know-how in every part of the economy; assembling sophisticated products can rely on imported inputs. Australia's commodity specialization does not establish generalized economic deterioration. See Harvard's trade-data methodology. The trade sources support the China–Australia resource-demand connection. The ranking trajectories alone do not quantify its contribution to Australia’s relative position.
The Philippines contextual annotation is supported by the Department of Trade and Industry's discussion of its semiconductor and electronics export specialization. It describes export composition rather than the domestic value added of every stage of semiconductor production.