
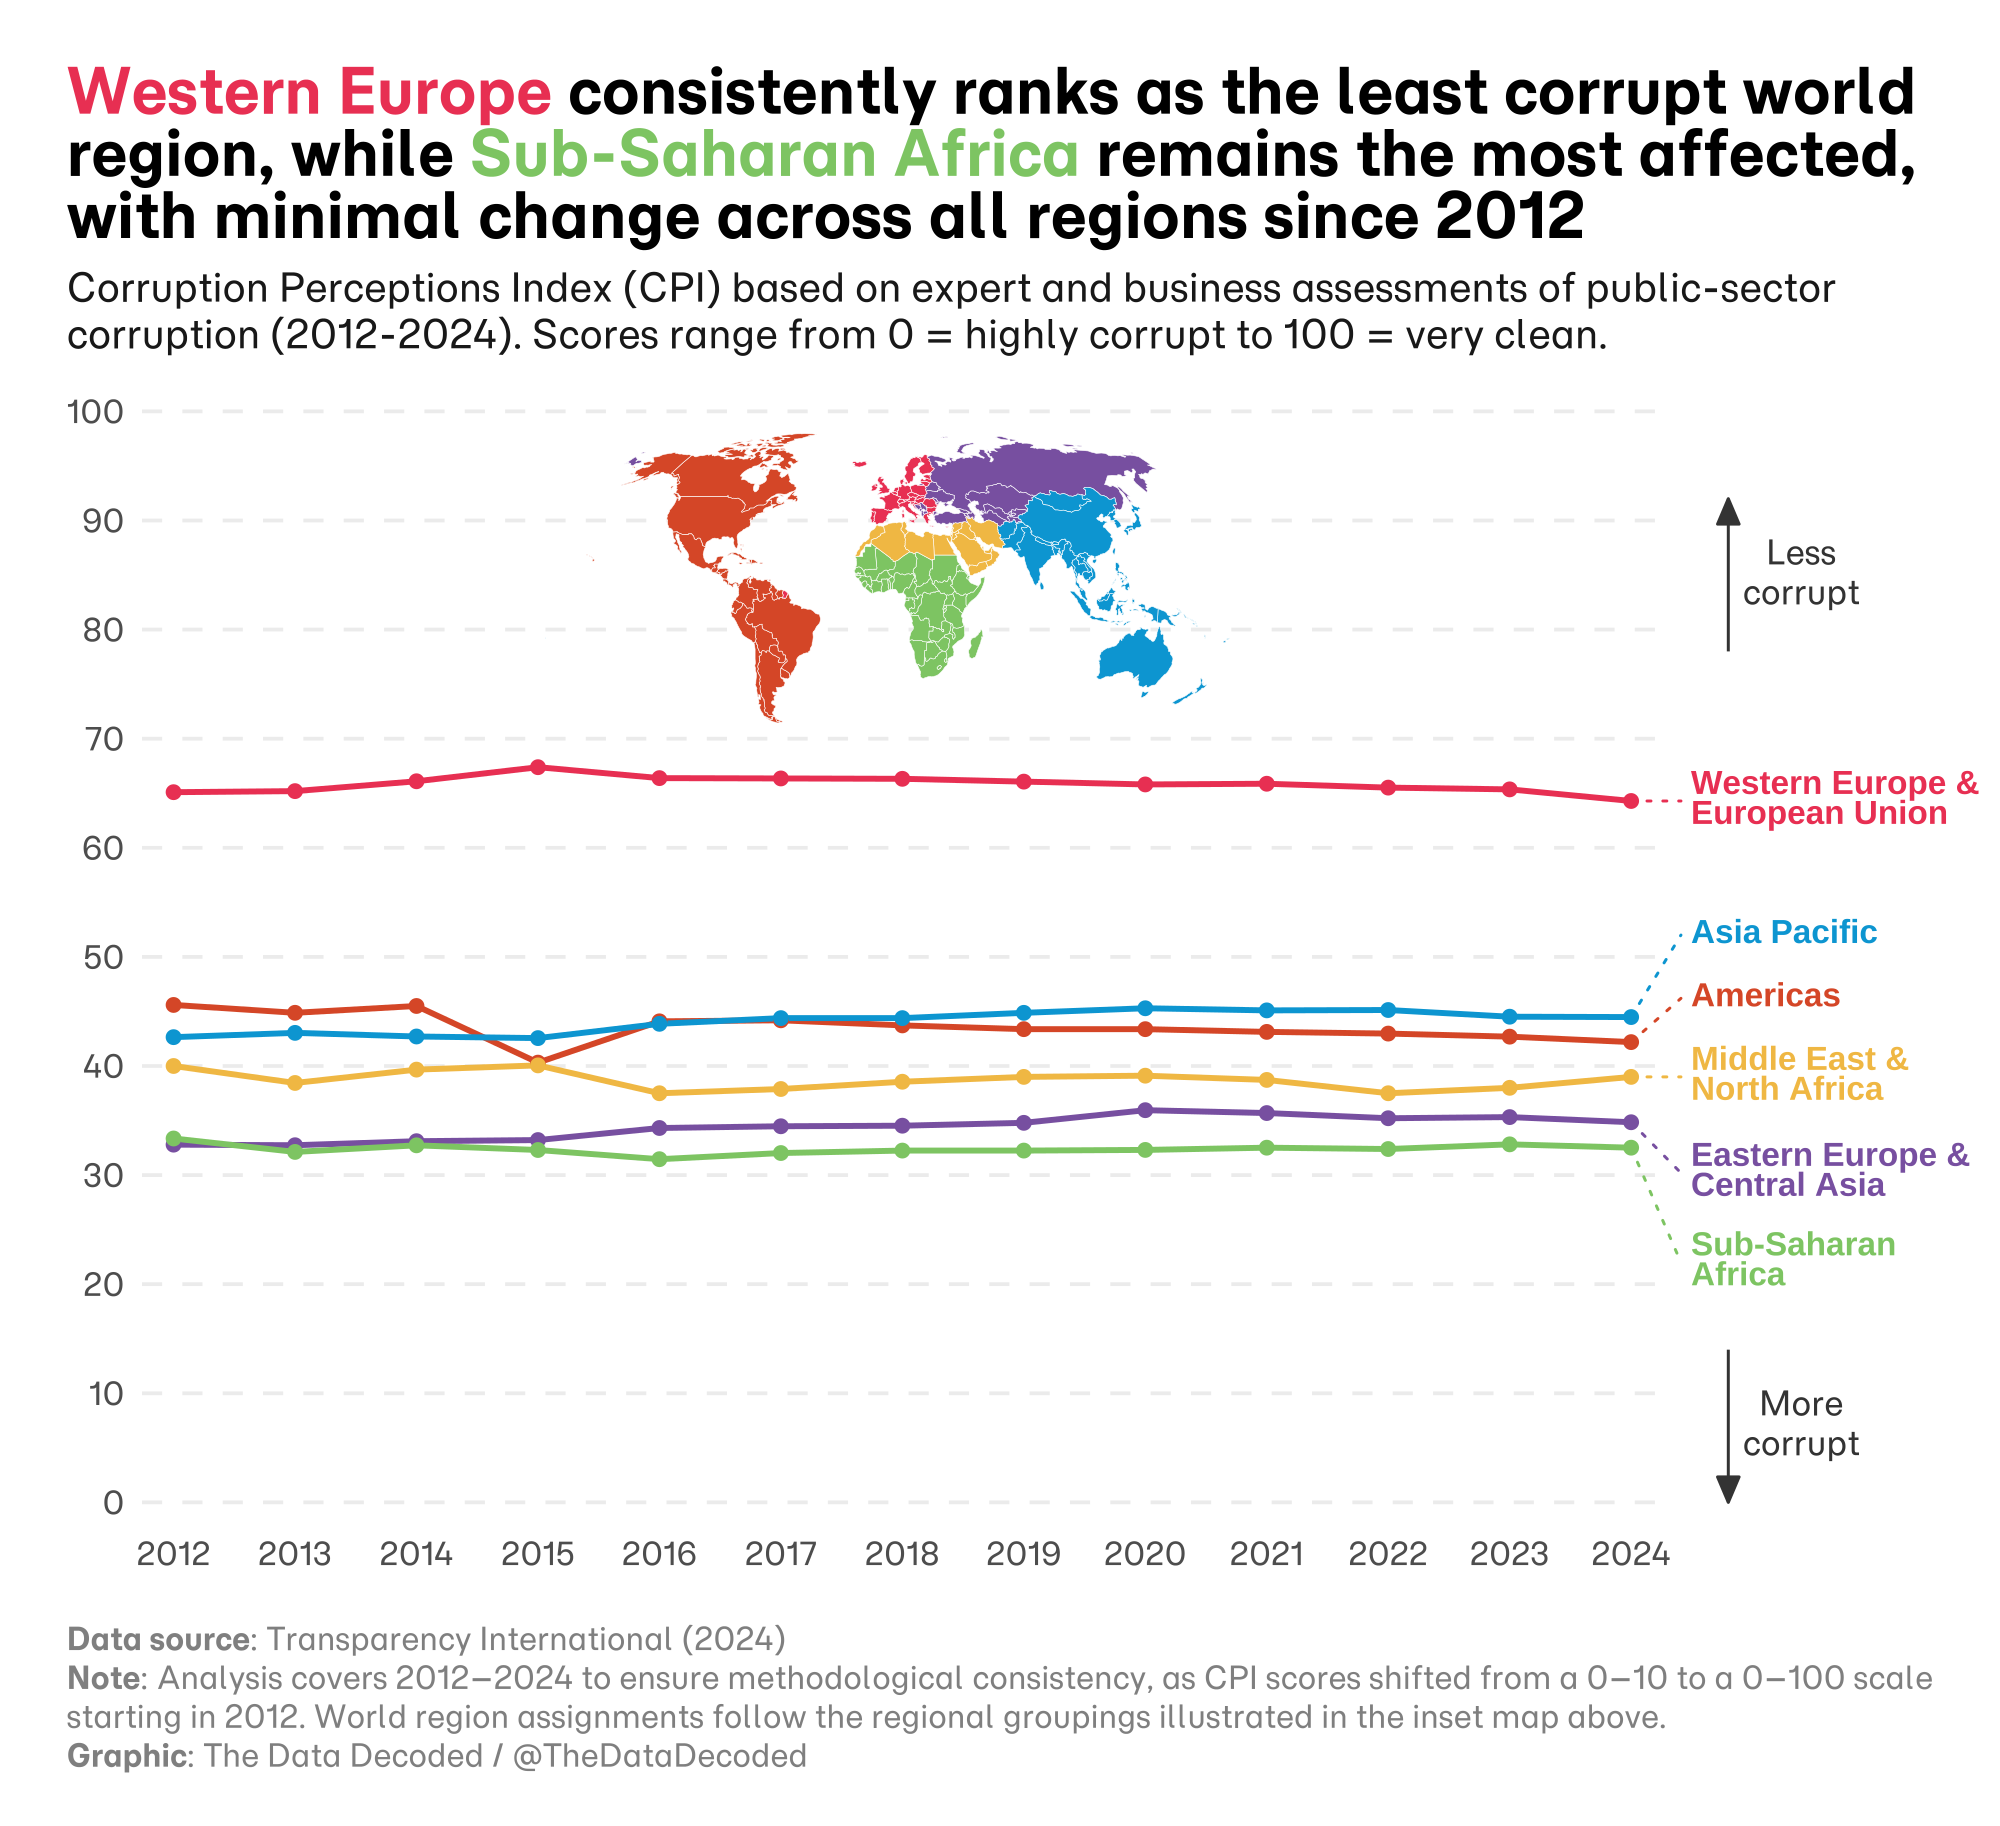
Perceived levels of public sector corruption by world region
Corruption Perceptions Index (CPI) in the period 2012-2024
This chart compares regional Corruption Perceptions Index scores from 2012 to 2024. The index runs from 0, perceived as highly corrupt, to 100, perceived as very clean.
Sources and methodology
The source is Transparency International's Corruption Perceptions Index (2024). The original analysis starts in 2012 because the CPI changed from a 0–10 to a 0–100 scale that year. Region assignments follow the groupings shown in the chart's inset map. The processing steps are in the original Quarto analysis.