
A global clock for science: timing patterns in arXiv submissions
A global clock for science: timing patterns in arXiv submissions
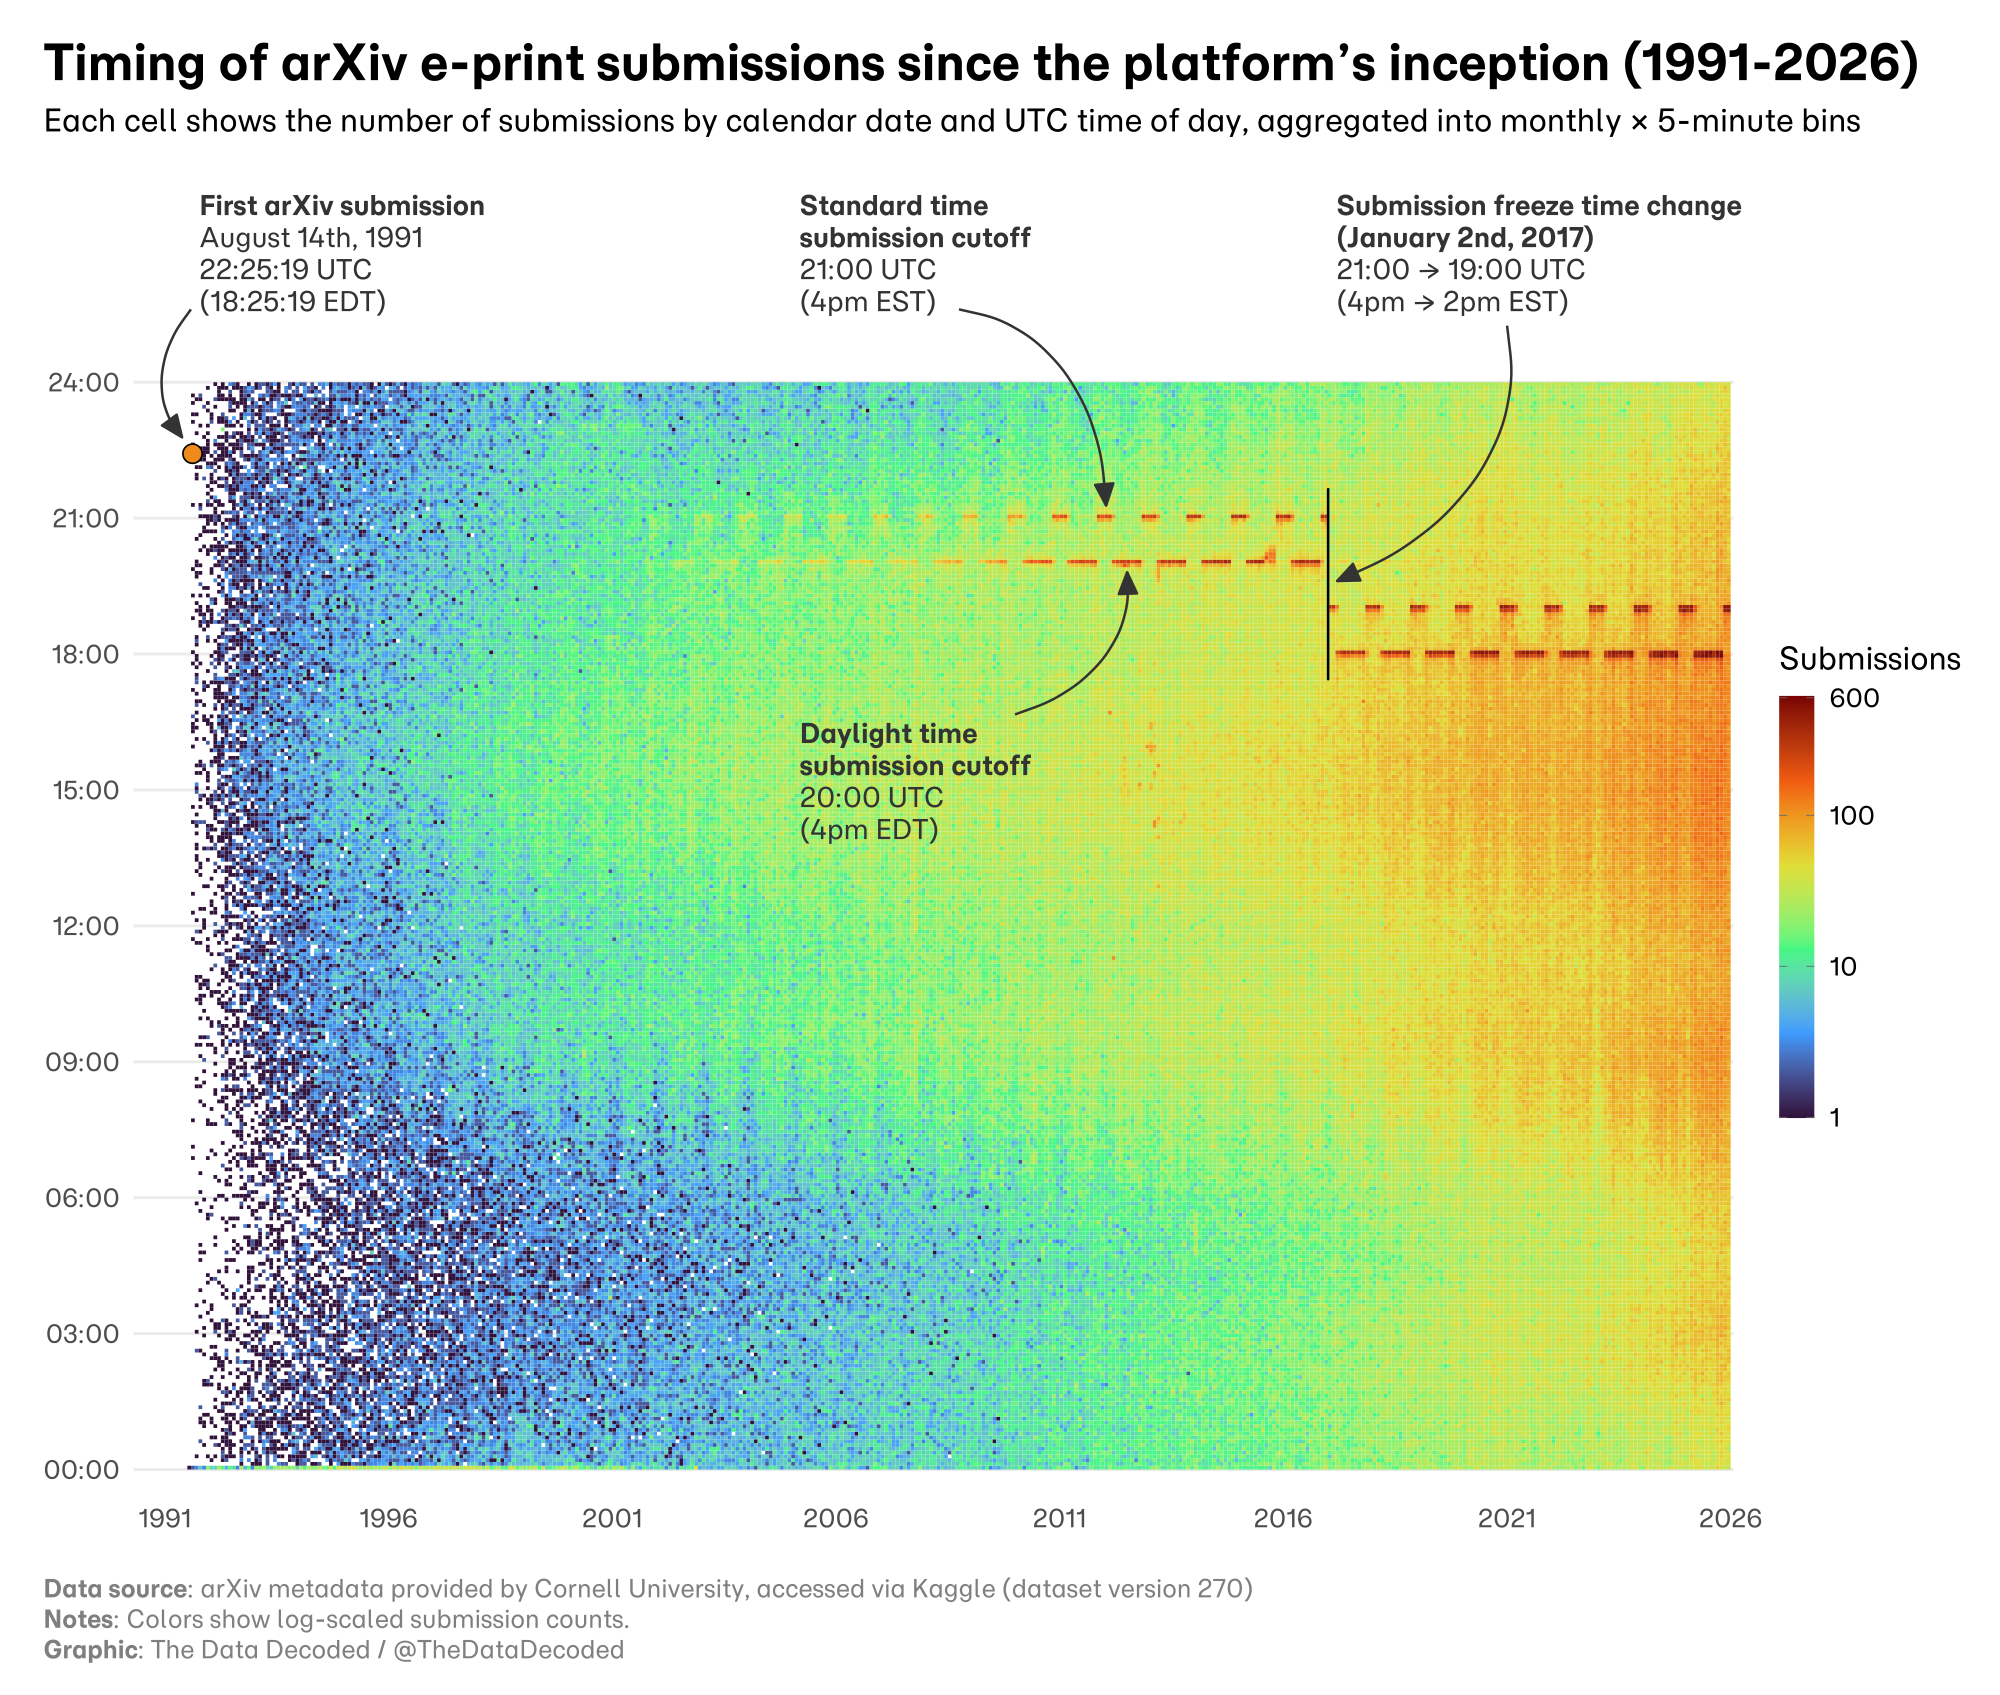
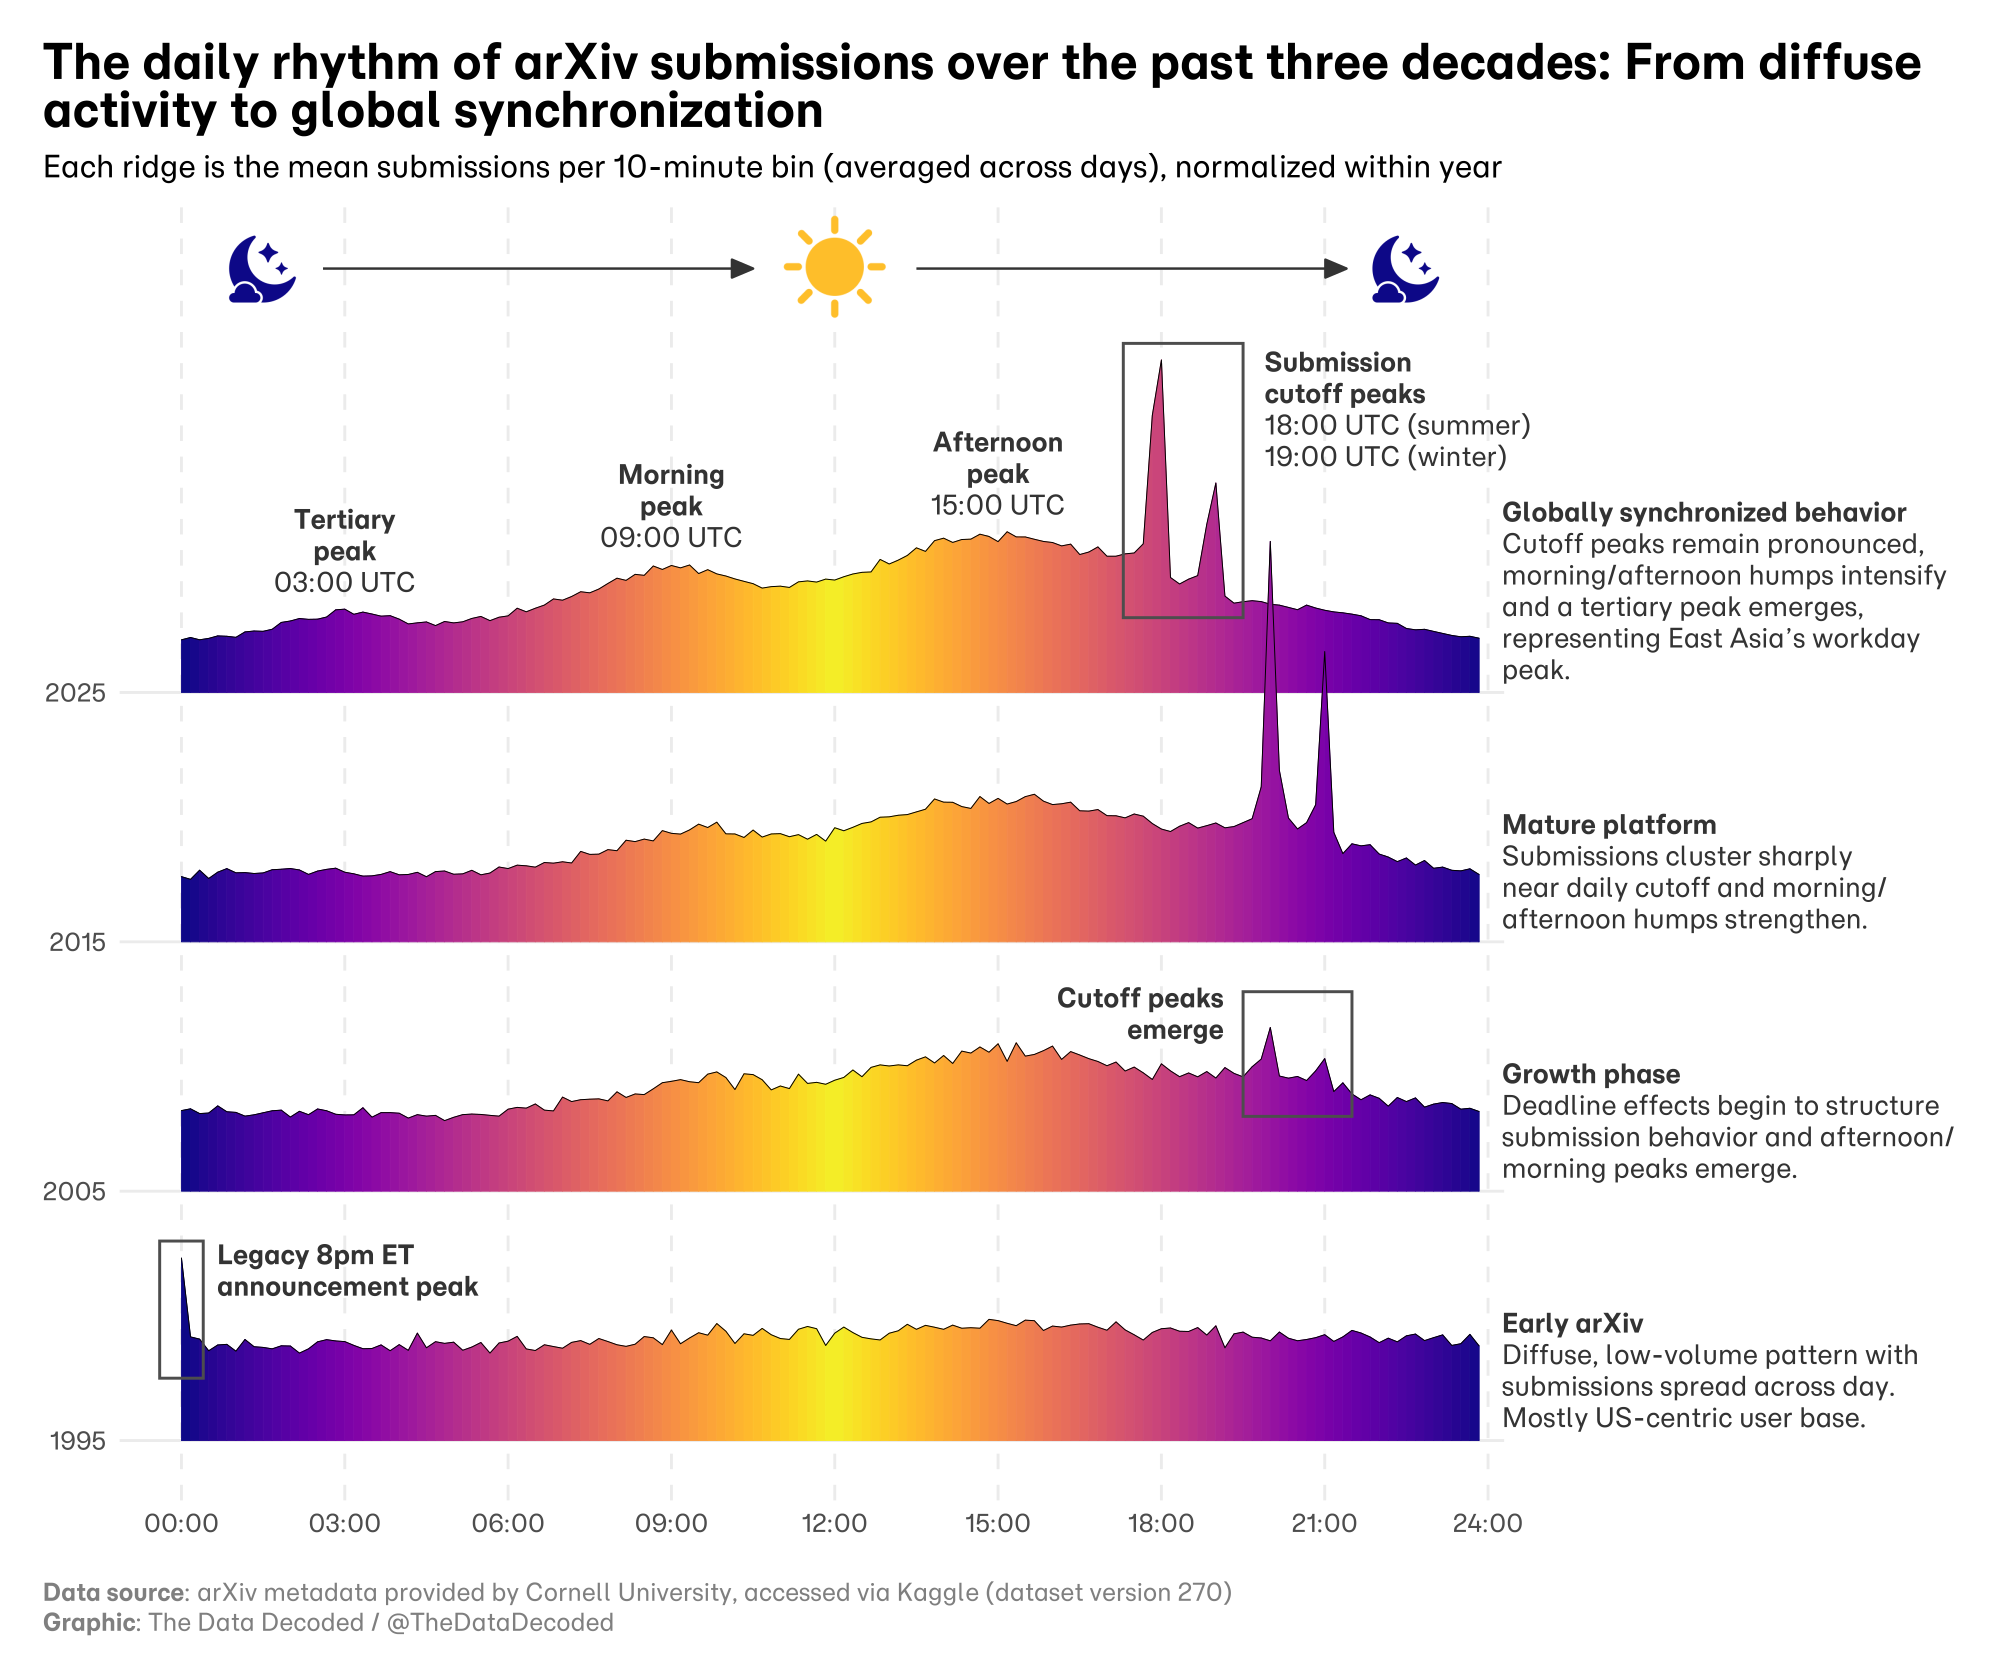
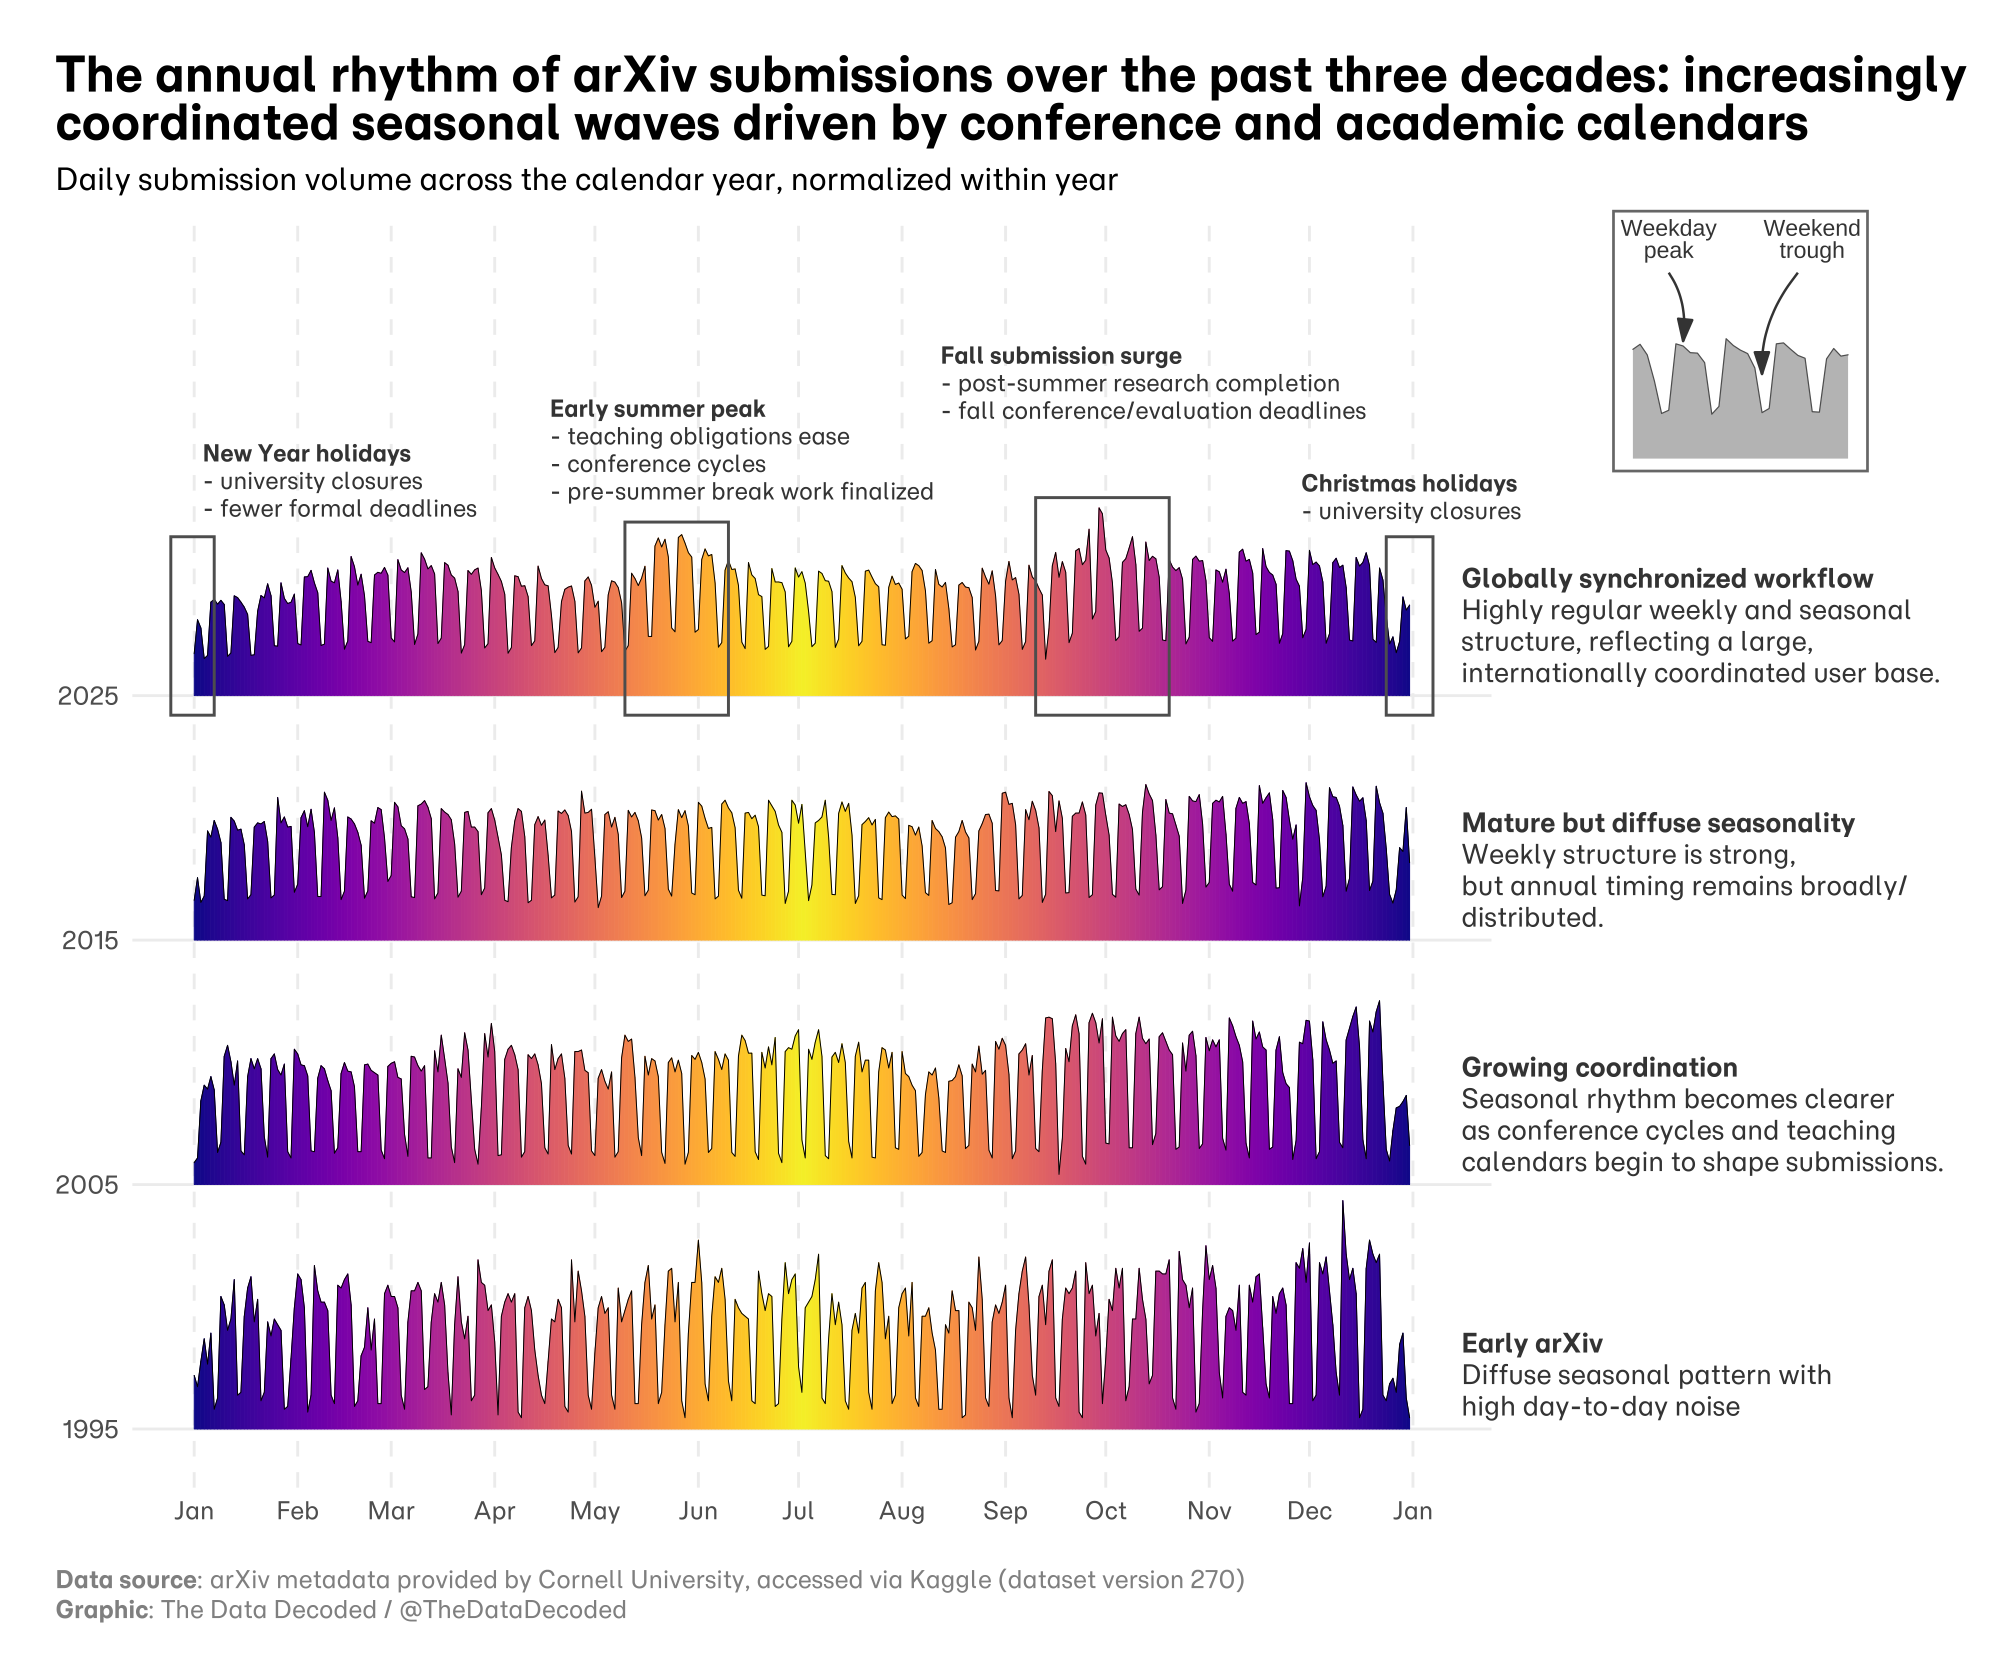
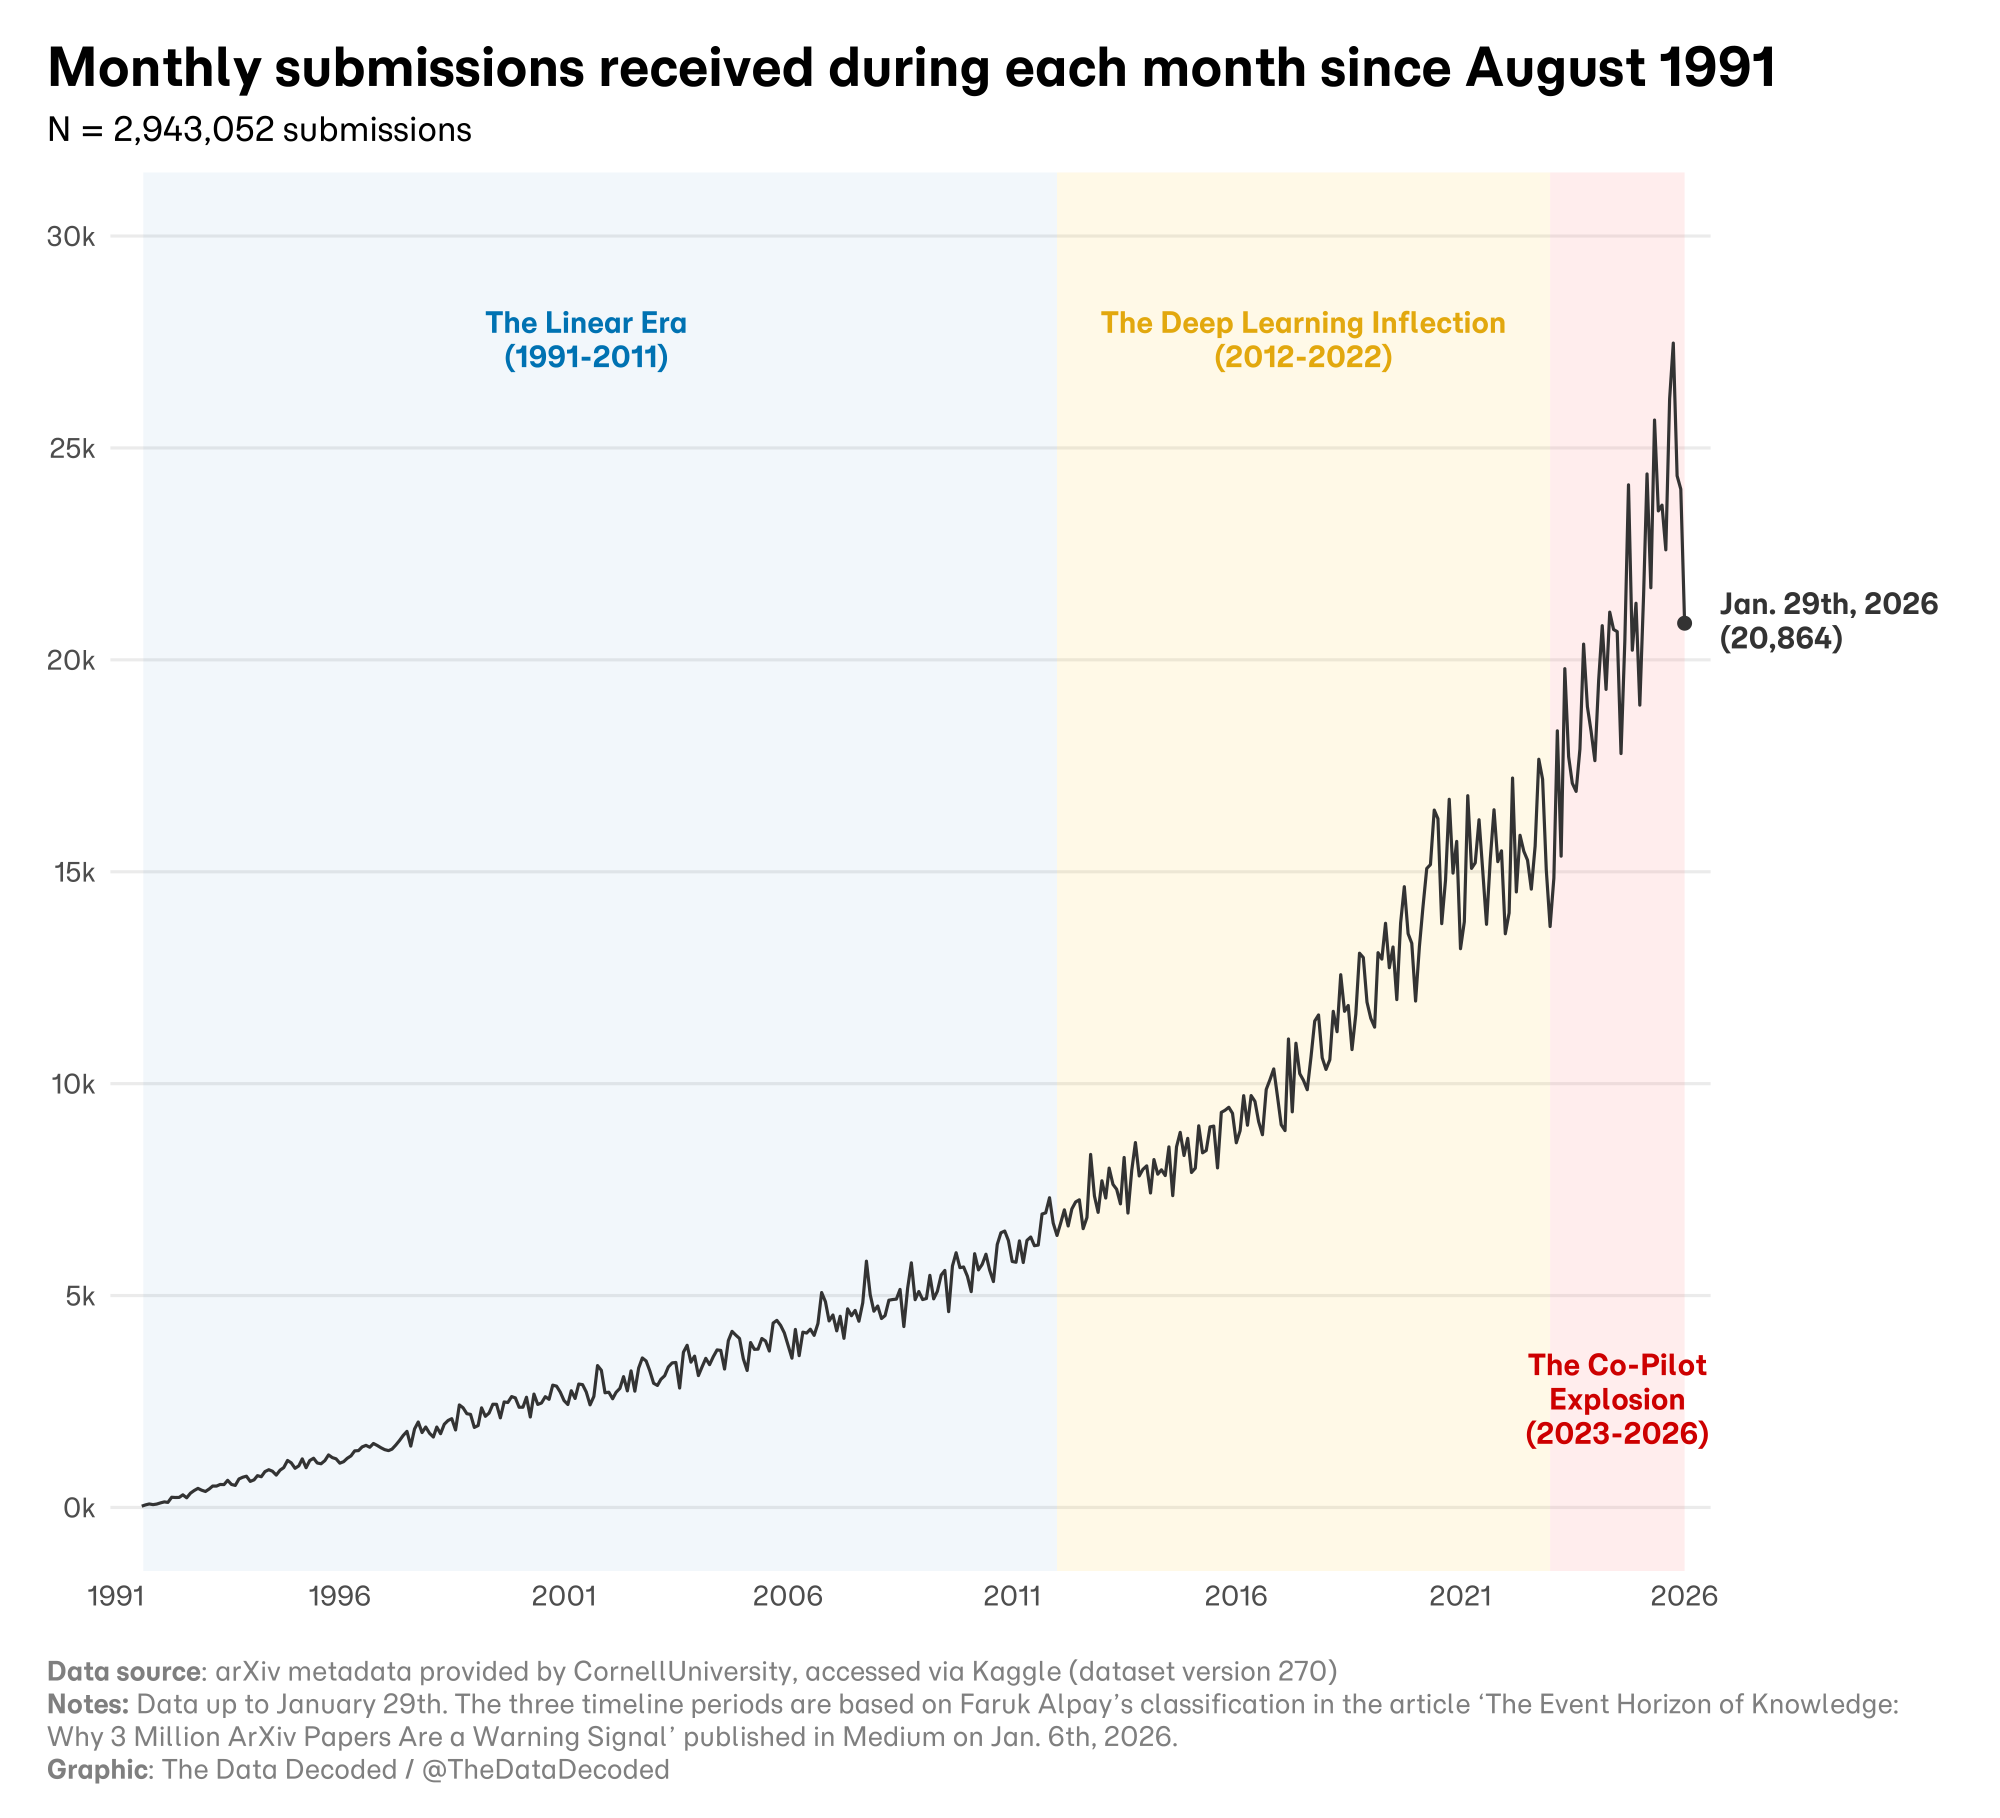
These charts look at when arXiv papers are submitted: across the archive's history, within a day, and through the year. The heatmap groups submissions into monthly by five-minute UTC bins; its colors use a logarithmic count scale. The labels describing eras in the monthly chart are an interpretive framing borrowed from Faruk Alpay's article, not periods or causes established by the submission counts.
Sources and methodology
The analysis uses arXiv metadata provided by Cornell University and accessed through the Kaggle arXiv dataset, version 270. The original chart notes data through January 29, 2026. The monthly chart attributes its era labels to Faruk Alpay's article; its first era ends in 2011 on the chart and in 2010 in the article. The original Quarto analysis parses submission timestamps and produces the heatmap, ridgeline views, and monthly series.